
Global market indices
US Stock Indices Price Performance
Nasdaq 100 +1.85% MTD and +13.50% YTD
Dow Jones Industrial Average +0.37% MTD and +7.44% YTD
NYSE +0.68% MTD and +11.51% YTD
S&P 500 +1.11% MTD and +11.06% YTD
The S&P 500 is +1.30% over the past seven days, with 4 of the 11 sectors up MTD. The Equally Weighted version of the S&P 500 is +0.29% over this past week and +6.69% YTD.
The S&P 500 Communication Services sector is the leading sector so far this month, +5.53% MTD and +23.69% YTD, while Financials is the weakest sector at -1.58% MTD and +9.68% YTD.
Over this past week, Information Technology outperformed within the S&P 500 at +2.80%, followed by Communication Services and Consumer Discretionary at +2.13% and +1.14%, respectively. Conversely, Financials underperformed at -0.72%, followed by Consumer Staples and Materials at -0.59% and -0.37%, respectively.
The equal-weight version of the S&P 500 was -0.14% on Wednesday, underperforming its cap-weighted counterpart by 0.44 percentage points.
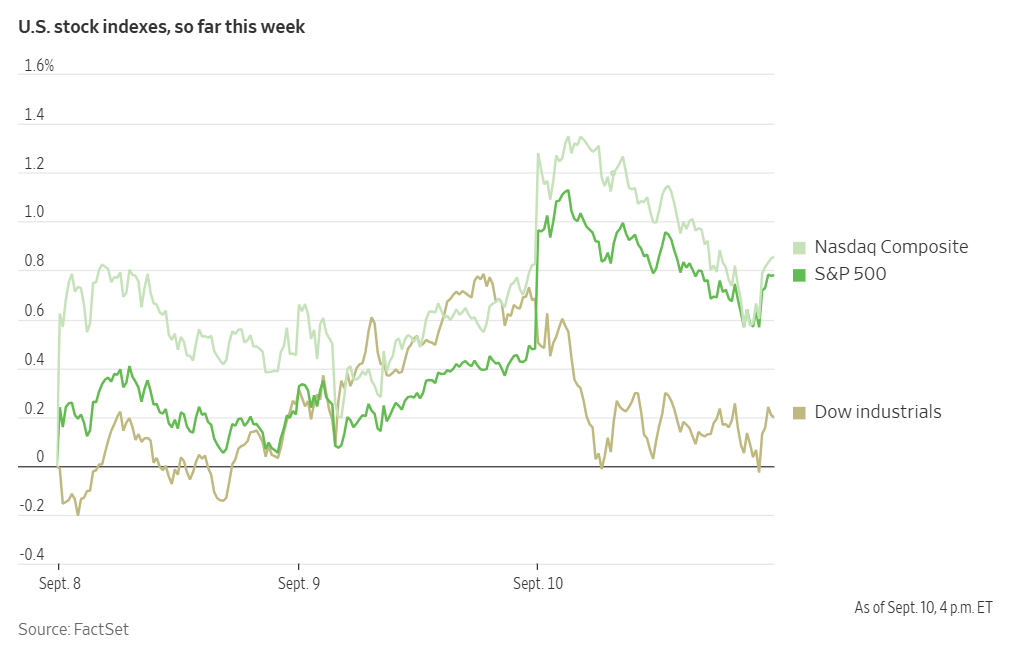
Oracle shares rallied +35.95%, propelling the S&P 500 to a new record high on Wednesday. It rose +0.30% to 6,532.04, while a decline in Apple stock weighed on the Dow Jones Industrial Average, which fell by 220 points, or -0.48%. The Nasdaq Composite rose +0.04%.
Shares of Oracle marked the company's best one-day percentage gain since 1992. This significant increase followed the database-software giant's announcement that it had secured several multi-billion dollar AI contracts during its most recent quarter. A report from The Wall Street Journal late Wednesday afternoon indicated that OpenAI and Oracle had entered into a $300 billion computing deal, one of the largest cloud contracts ever signed.
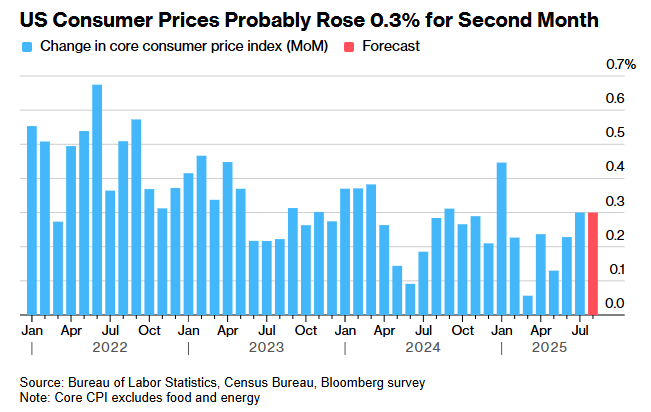
Looking ahead, options traders are anticipating a modest market reaction to today’s Consumer Price Index (CPI) report. According to Bloomberg news, Stuart Kaiser, head of US equity trading strategy at Citigroup, said traders are betting on a swing of less than 0.7% in either direction for the S&P 500. This is below the average CPI day movement of 0.9% over the past year and also less than the volatility expected following the next jobs report on 3rd October.
In corporate news, Klarna Group shares surged in their trading debut, following an IPO that raised $1.37 billion. This successful listing suggests a positive outlook for the market for new public offerings.
JPMorgan Chase, Fifth Third Bancorp, and Barclays are preparing for potential combined losses totalling hundreds of millions of dollars from loans linked to the subprime auto lender Tricolor Holdings.
The CEO of Delta Air Lines, Ed Bastian, said consumer confidence has rebounded after experiencing a significant impact from tariffs and earlier economic disruption this year.
In a move to expand its partnership with Joby Aviation, Uber Technologies will enable its customers to book Blade's helicopter and seaplane services directly through the Uber app beginning next year.
Lyft is now piloting autonomous rides in Atlanta. These rides include a safety driver and represent a long-anticipated launch aimed at strengthening the company's competitive position against rivals such as Waymo and Uber.
Chipotle Mexican Grill is entering the Asian market with plans to open locations in South Korea and Singapore in 2026.
Mega caps: The Magnificent Seven had a mostly positive performance over the past week. Over the last seven days, Tesla +4.10%, Nvidia +3.93%, Alphabet +3.69%, Meta Platforms +2.03%, and Amazon +1.92%, while Microsoft -0.99%, and Apple -4.90%.
Energy stocks had a mostly positive performance this week, with the Energy sector itself +0.66%. WTI and Brent prices are +0.13% and +0.27%, respectively, this week. Over this past week, Energy Fuels +11.04%, Halliburton +4.68%, Baker Hughes +4.27%, APA +2.69%, Marathon Petroleum +1.50%, Phillips 66 +0.68%, ExxonMobil +0.53%, and Occidental Petroleum +0.02%, while Chevron -0.17%, ConocoPhillips -0.35%, BP -0.84%, and Shell -1.41%.
Materials and Mining stocks had a mostly negative performance this week, with the Materials sector -0.37%. Over the past seven days, Newmont Corporation +3.99%, CF Industries +2.51%, Mosaic +2.20%, and Yara International +1.03%, while Celanese Corporation -0.94%, Nucor -2.29%, Sibanye Stillwater -2.44%, Freeport-McMoRan -2.88%, and Albemarle -8.48%.
European Stock Indices Price Performance
Stoxx 600 +0.33% MTD and +8.11% YTD
DAX -1.58% MTD and +18.62% YTD
CAC 40 +0.75% MTD and +5.16% YTD
IBEX 35 +1.89% MTD and +31.24% YTD
FTSE MIB -0.45% MTD and +22.88% YTD
FTSE 100 +0.41% MTD and +12.88% YTD
This week, the pan-European Stoxx Europe 600 index is +1.01%. It was -0.02% on Wednesday, closing at 552.29.
So far this month in the STOXX Europe 600, Banks is the leading sector, +3.02% MTD and +44.43% YTD, while Travel & Leisure is the weakest at -2.47% MTD and -1.85% YTD.
This week, Retail outperformed within the STOXX Europe 600, at +3.58%, followed by Construction & Materials and Banks at +3.43% and +3.31%, respectively. Conversely, Autos & Parts underperformed at -1.99%, followed by Food & Beverages and Health Care at -1.51% and -0.97%, respectively.
Germany's DAX index was -0.36% on Wednesday, closing at 26,632.95. It was +0.16% over the past seven days. France's CAC 40 index was +0.15% on Wednesday, closing at 7,761.32. It was +0.54% over the past week.
The UK's FTSE 100 index was +0.52% last week to 9,225.39. It was -0.19% on Wednesday.
In Wednesday's trading session, Retail was the outperformer, primarily driven by Inditex, which reported a more robust-than-expected 9% y/o/y sales growth, offsetting the impact of softer H1 revenue, which at €18.36 billion, came in below market estimates. The positive sentiment was further bolstered by higher gross margins and lean inventory levels.
Clas Ohlson’s shares rallied following a strong Q1 performance, exceeding expectations with EPS of 3.27 SEK against an estimated 2.93 SEK. The company's profit reached 278 million SEK, with August sales increasing by 5%. These strong results prompted the company to provide guidance for 5% organic growth and a 7 SEK dividend. Conversely, while Wickes Group traded higher following stable results, Associated British Foods shares fell. This was attributed to a decline in Primark's like-for-like sales, which fell by 2.4% in Q3 and 2% in Q4, reflecting weak consumer sentiment.
The healthcare sector also traded higher. Novo Nordisk announced approximately 9,000 job cuts, or 11.5% of its workforce, as part of a restructuring effort, with the aim of achieving $1.26 billion in savings and a renewed focus on diabetes and obesity treatments. However, the company reduced its FY 2025 EBIT growth forecast to a range of 4% - 10%. Additionally, Carl Zeiss Meditec’s shares advanced after Barclays initiated coverage with an ‘overweight’ rating, citing a recovery in China and demand for premium intraocular lenses.
The Industrial Goods & Services sector rose after Alstom secured a $1.17 billion deal with NJ Transit. In parallel, the Aerospace & Defence sector gained ground amid reports of a potential merger of the space divisions of Airbus, Leonardo, and Thales.
The Technology sector rose after a positive re-evaluation of SAP, which benefited from a cloud upgrade by Oracle. This highlighted expectations for accelerated AI and cloud adoption in 2026 - 2027.
Travel & Leisure was the underperformer of the day, with airlines being hit particularly by French strikes that led to the cancellation of hundreds of flights. In contrast, the recreation sub-sector saw The Gym Group jump on robust H1 results and an upgraded EBITDA guidance.
Telecom, Chemicals, and Real Estate were among the notable underperformers of Wednesday’s session.
Other Global Stock Indices Price Performance
MSCI World Index +1.39% MTD and +14.68% YTD
Hang Seng +4.48% MTD and +30.61% YTD
The MSCI World Index is +1.73% over the past 7 days, while the Hang Seng Index is +3.38% over the past 7 days.
Currencies
EUR +0.11% MTD and +13.00% YTD to $1.1697.
GBP +0.19% MTD and +8.13% YTD to $1.3528.
The US dollar experienced a mixed day of trading on Wednesday, showing no clear direction following data that revealed an unexpected decline in August producer prices. This development solidified market expectations that the Fed will resume cutting interest rates at its meeting next week.
After the inflation data was released, the dollar saw a slight gain against the yen, reaching ¥147.38, while the euro slipped -0.12% to $1.1706. Before the data, the dollar had been trading moderately higher against both currencies.
The dollar index was up slightly by +0.08% at 97.82. Over the last seven days, the US dollar index is -0.33% to 97.82. It is -0.03% MTD, and -9.83% year-to-date. The dollar index has declined by -9.83% this year, largely influenced by chaotic US trade and fiscal policies and increasing concerns about the independence of the Fed.
Markets showed little reaction to a court ruling that temporarily blocked the US President's attempt to remove Fed Governor Lisa Cook, a case that is widely expected to be appealed to the US Supreme Court.
On Wednesday, the pound sterling remained stable, restrained by a strong dollar and a feeling of anticipation leading up to next week's Bank of England rate meeting. Sterling was up a slight +0.01% at $1.3528. The pound has since recovered from its early September decline, when investor concerns about Britain's financial outlook led to a sell-off of long-dated government bonds, pushing yields to their highest levels since the late 1990s. This recovery is supported by the belief that the BoE is unlikely to cut rates significantly for the time being, unlike the Fed, which is expected to lower borrowing costs.
Over the last seven days, the euro is +0.32% against the US dollar, and sterling is +0.65%. This week, the US dollar traded -0.45% against the Japanese yen.
Note: As of 5:00 pm EDT 10 September 2025
Fixed Income
US 10-year yield -18 bps MTD and -53 bps YTD to 1%.
German 10-year yield -7.0 bps MTD and +28.8 bps YTD to 2.657%.
UK 10-year yield -9.1 bps MTD and +6.5 bps YTD to 4.633%.
US Treasury yields declined on Wednesday, driven by an unexpected drop in August producer prices that bolstered the case for an interest rate reduction by the Fed. The downward trend in yields was further reinforced in the afternoon by a strong 10-year note auction.
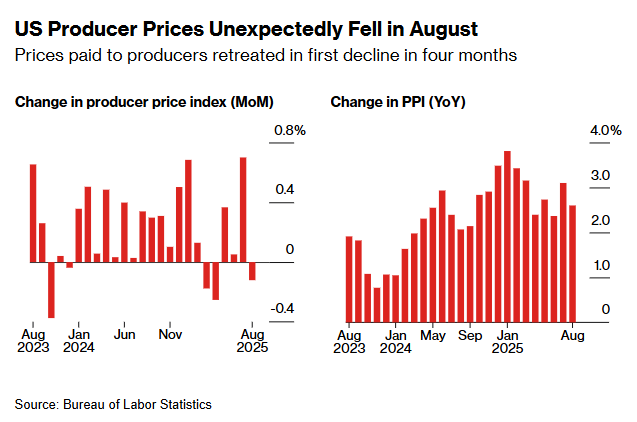
The Labor Department reported that its Producer Price Index (PPI) for final demand decreased by 0.1% m/o/m in August, a significant deviation from the consensus forecast of a 0.3% m/o/m increase. This decline followed a downwardly revised 0.7% jump in July and was largely attributed to a drop in the cost of services.
Demand for US debt supply was strong, as evidenced by the Treasury's sale of $39 billion in 10-year notes. The auction's bid-to-cover ratio was 2.65x, the highest since April. Indirect bidders, which include foreign central banks and investors, were awarded their second-highest percentage on record. Conversely, primary dealers (the financial institutions designated by the Fed to participate in all Treasury auctions) received a record low 4.2% of the total auction for their own accounts.
Today, the market's attention will focus on the Treasury's $22 billion sale of 30-year bonds, which will further indicate the demand for long-term US debt.
The yield on the 10-year Treasury note fell -3.7 bps to 4.053%. Similarly, the yield on the 30-year bond declined by -3.9 bps to 4.698%, after an initial post-inflation data rise. The spread between the two- and 10-year Treasury notes flattened to +50.3 bps, contracting from 59.6 bps last week. The yield on the two-year Treasury note, which is highly sensitive to Fed policy expectations, slipped by -2.7 bps to 3.550%.
Over the past seven days, the yield on the 10-year Treasury note was -16.8 bps. The yield on the 30-year Treasury bond was -19.7 bps. On the shorter end, the two-year Treasury yield was -7.5 bps.
Fed funds futures traders are now pricing in a 92.0% probability of a 25 bps rate cut next week and a 8.0% possibility of a 50 bps rate cut, according to CME Group's FedWatch Tool. Traders are currently pricing in 68.1 bps of cuts by year-end, higher than last week’s 58.4 bps.
Across the Atlantic, in the UK, on Wednesday the 10-year gilt was +0.8 bps to 4.633%. The UK 10-year yield was -11.6 bps over the past seven days. The 30-year gilt ended the day +1.0 bps to 5.484% on Wednesday and is -9.5 bps over the past seven days.
Government bond yields in the eurozone experienced a slight decline on Wednesday, following the unexpected decrease in US producer prices for August and preceding a crucial meeting of the ECB.
Markets expect the ECB to hold its main interest rate at 2.0% after today's meeting. The central bank's long-term policy outlook is of primary interest to investors.
The yield on Germany's 10-year bond fell by -0.3 bps to 2.657%. On the short-end of the German curve, the 2-year Schatz rose by +1.1 bps to 1.963%, conversely, on the long-end of the curve, the 30-year yield declined by -0.4 bps to 3.276%. Market projections indicate that interest rate cuts are not anticipated until at least December of next year.
French yields remained relatively stable on Wednesday, with the 10-year French yield falling -1.3 bps to 3.397%. This follows the new Prime Minister, Sébastien Lecornu, pledging to find collaborative solutions with political rivals to pass a budget aimed at reducing national debt, while also signalling new policy directions.
The selection of Lecornu, a former conservative protégé, by President Emmanuel Macron underscores the president's commitment to advancing his pro-business reform agenda despite governing with a minority.
The yield spread between French and German 10-year government bonds, a key indicator of the risk premium for French debt, contracted by 6.4 bps from the previous week's 80.4 bps, settling at 74.0 bps.
Over the past seven days, the German 10-year yield was -8.6 bps. Germany's two-year bond yield was +0.1 bps, and on the longer end of the spectrum, Germany's 30-year yield was -7.9 bps.
The spread between US 10-year Treasuries and German Bunds is now 139.6 bps, 8.2 bps lower than last week’s 147.8 bps.
The spread between Italian BTP 10-year yields and German Bund 10-year yields stood at 81.4 bps, a 5.7 bps contraction from 87.1 bps last week. The Italian 10-year yield is -14.3 bps over last week.
Commodities
Gold spot +5.62% MTD and +38.71% YTD to $3,640.39 per ounce.
Silver spot +3.72% MTD and +42.46% YTD to $41.13 per ounce.
West Texas Intermediate crude -0.41% MTD and -11.11% YTD to $63.75 a barrel.
Brent crude -0.81% MTD and -9.41% YTD to $67.57 a barrel.
Gold prices remained near their all-time highs on Wednesday, a trend bolstered by growing market expectations that the Fed will resume easing policy at its meeting next week. This sentiment was fuelled by US inflation data, which came in softer than anticipated.
Spot gold rose by +0.41%, reaching $3,640.39 per ounce, following its record high of $3,673.95 on Tuesday. Gold prices are +2.29% over the past seven days and +38.71% YTD.
On Wednesday, Brent crude futures settled up $1.04, or +1.56%, at $67.57 a barrel. Similarly, US WTI crude futures rose by $0.77, or +1.22%, to settle at $63.75 a barrel.
This week, WTI and Brent are +0.13% and +0.27%, respectively.
Geopolitical tensions escalated after Poland, a NATO member, shot down drones in its airspace during a large-scale Russian attack on western Ukraine. This marks the first time a NATO member has fired shots during the conflict.
The previous day, oil prices had settled less than one percent higher following an Israeli attack on Hamas leadership in Qatar, an event that had initially pushed both benchmarks up by nearly two percent before they retraced most of those gains. Despite these events, there was no immediate threat to oil supply. Geopolitical risk premiums in the oil market are typically short-lived unless they lead to actual supply disruptions.
The US President has urged the EU to impose 100% tariffs on major buyers of Russian oil, such as China and India, as a strategy to pressure Moscow into peace negotiations with Ukraine. European Commission President Ursula von der Leyen said the bloc is considering a faster phase-out of Russian fossil fuels as part of new measures against Moscow. However, it is highly improbable that the 27-member bloc will impose crippling tariffs on India or China.
On Tuesday, the Energy Information Administration (EIA) warned that global crude prices are likely to face significant downward pressure in the coming months due to anticipated output increases by OPEC+.
EIA report. Based on data released Wednesday by the EIA, US crude and fuel inventories increased last week, a development attributed to a decrease in both exports and demand.
Overall crude stockpiles expanded by 3.9 million barrels, reaching a total of 424.6 million barrels for the week ending 5th September. While this overall figure rose, crude stocks at Cushing, Oklahoma—a key delivery hub—actually experienced a decline of 365,000 barrels.
This increase in national inventory was primarily driven by a 1.1 million barrels per day (bpd) drop in US crude exports, which fell to 2.8 million bpd. Concurrently, net crude imports increased by 668,000 bpd. Despite the larger inventories, refinery crude runs decreased by 51,000 bpd, even as utilisation rates saw a modest rise of 0.6 percentage points, reaching 94.9%.
Total product supplied, a metric often used as a proxy for consumer demand, fell by 871,000 bpd to 19.8 million bpd. This decline was evident across key fuel types: gasoline consumption dropped by 609,000 bpd to 8.5 million bpd, and distillate product supplied (which includes diesel and heating oil) was down by 391,000 bpd to 3.4 million bpd. Correspondingly, both gasoline and distillate stockpiles saw notable increases. Gasoline inventories grew by 1.5 million barrels to 220 million barrels, while distillate stockpiles rose by 4.7 million barrels to 120.6 million barrels.
Note: As of 5:00 pm EDT 10 September 2025
Key data to move markets
EUROPE
Thursday: ECB Monetary Policy Decision, ECB Rate on Deposit Facility, ECB Main Refinancing Operations Rate, and ECB Press Conference.
Friday: German, French and Italian Harmonised Index of Consumer Prices, and Consumer Price Indexes (CPIs), and a speech by Bundesbank President Joachim Nagel.
Tuesday: Italian CPI, German ZEW surveys on Economic Sentiment and Economic Situation, Eurozone’s Industrial Production and ZEW Survey on Economic Sentiment.
Wednesday: Eurozone Core Harmonised Index of Consumer Prices and Harmonised Index of Consumer Prices.
UK
Friday: GDP, Industrial Production, Manufacturing Production, and Consumer Inflation Expectations.
Tuesday: Average Earnings, Claimant Count Change and Rate, Employment Change, and ILO Unemployment Rate.
Wednesday: CPI, Core CPI, and Retail Price Index.
USA
Thursday: Initial and Continuing Jobless Claims, CPI, and Core CPI.
Friday: Michigan Consumer Expectations Index and Consumer Sentiment Index, UoM 1-year and 5-year Consumer Inflation Expectations.
Monday: NY Empire State Manufacturing.
Tuesday: Retail Sales, Retail Sales Control Group, and Industrial Production.
Wednesday: Building Permits, Housing Starts, Fed Interest Rate Decision, Fed Monetary Policy Statement, FOMC Economic Projections, FOMC Press Conference, and Interest Rate Projections - Current, 1st year, 2nd year and 3rd year.
CHINA
Monday: Industrial Production and Retail Sales.
JAPAN
Friday: Industrial Production.
Tuesday: Exports, Imports, Merchandise Trade Balance and Adjusted Merchandise Trade Balance.
Global Macro Updates
Gold’s enduring allure. Despite dollar weakening throughout this year and cries that the “dollar era” is over, the most recent IMF survey on the Currency Composition of Official Foreign Exchange Reserves (COFER) shows that the US dollar maintains its position as the dominant reserve currency. As reported by Alphaville in the Financial Times, of the $11.6 trillion in global allocated foreign exchange (FX) reserves, the dollar accounts for $6.7 trillion, or 58% of the total. However, this figure doesn’t tell the whole picture.
The IMF's COFER report breaks down currency allocations, not specific asset classes. This means the $6.7 trillion figure for the US dollar includes a variety of debt instruments, such as US agency bonds, in addition to US Treasuries. The US Treasury's Treasury International Capital (TIC) report for the end of June indicates that foreigners hold $9.1 trillion in US Treasury bills and bonds, with an estimated $3.9 trillion held by foreign central banks.
To compare this to central bank gold holdings, the IMF provides data on the number of Troy ounces held by central banks. By multiplying this with the market price of gold, it can be estimated that gold's share of total international reserves was approximately 22% at the end of June. At that time, the calculated value of central bank gold holdings was $3.86 trillion, slightly less than the $3.92 trillion figure for foreign official holdings of US Treasuries. However, since the end of June, the price of gold has increased by an additional 10.22%. Even without accounting for recent central bank purchases, this price change alone would push the value of international gold reserves to approximately $4.2 trillion.
The World Gold Council has noted a continued appetite for gold among central banks. In July, for instance, the Central Bank of the Republic of Turkey, the PBoC, and the Czech National Bank each added 2 tonnes of gold to their reserves. The pace of accumulation has been steady, with Turkey purchasing gold for 26 consecutive months and the Czech National Bank for 29 months. The PBoC has been a net buyer for nine consecutive months.
Despite these sustained purchases, the National Bank of Poland remains the largest net purchaser for the year, with 67 tonnes added, although its reserves have remained stable since May.
While there has been an increase in the value of central bank gold holdings, the narrative of a dramatic flight from US Treasuries can be largely overstated. The value of gold reserves surpassing foreign official holdings of US debt is primarily a result of the 38.71% surge in gold prices during 2025, a phenomenon partly driven by central bank buying itself.
By volume, central bank gold holdings bottomed in March 2009 and have been steadily increasing since then. Moreover, while Treasury prices have risen over the past year, the value of US government debt has not fully recovered to its pre-inflationary levels of five years ago.
This shift in reserve composition appears to be more a reflection of recent price movements than a fundamental change in central bank asset allocation. Future price movements could be influenced by falling interest rates and ongoing demand for safe-haven assets. Conversely, shifts in Fed policy or the resolution of geopolitical risks could trigger a price pullback.
Sell-side forecasts for gold's future price vary considerably. Goldman Sachs projects gold reaching $4,000 by mid-2026 and potentially nearing $5,000 if a falling dollar prompts investors to move assets into gold. JPMorgan forecasts an average price of $3,675 by Q4 2025, potentially rising toward $4,000 by Q2 2026. UBS sees gold reaching $3,700 per ounce by late 2026, citing US economic pressures.
It's important to approach central bank reserve data with caution, as it can be unreliable. Both the TIC and COFER reports have limitations. The US Treasury faces challenges in accurately attributing ownership in its TIC data, as foreign central banks are increasingly using intermediary custodians to obscure direct holdings. Similarly, COFER data is largely self-reported and may not capture a country's full reserve position. For instance, countries like China hold substantial de facto foreign reserves in state-owned banks, insurers, and pension plans, a portion of which is also in Treasuries.
Nevertheless, there is a clear trend of reserve managers shifting from US Treasuries to gold. This is driven by both long-standing concerns about the ‘weaponisation’ of the US dollar and more recent apprehensions regarding the economic policies of the Trump administration and Fed independence.
While every effort has been made to verify the accuracy of this information, LHCM Ltd. (hereafter known as “EXANTE”) cannot accept any responsibility or liability for reliance by any person on this publication or any of the information, opinions, or conclusions contained in this publication. The findings and views expressed in this publication do not necessarily reflect the views of EXANTE. Any action taken upon the information contained in this publication is strictly at your own risk. EXANTE will not be liable for any loss or damage in connection with this publication.
Ten artykuł jest publikowany wyłącznie w celach informacyjnych i nie powinien być traktowany jako oferta lub zachęta do kupna lub sprzedaży jakichkolwiek inwestycji lub powiązanych usług, do których można się tu odwołać. Obrót instrumentami finansowymi wiąże się ze znacznym ryzykiem strat i może nie być odpowiedni dla wszystkich inwestorów. Wyniki osiągnięte w przeszłości nie są wiarygodnym wskaźnikiem wyników w przyszłości.