
The Strait of Reckoning

Renée Friedman, Global Head of Research

Horacio Coutino, Multi-asset Strategist
“The only thing new in the world is the history you do not know.” — Harry S. Truman
This report reviews and considers:
• What the longer term consequences on oil, LNG and fertiliser markets may mean for the global economy
• How demand is changing and the possible impact on asset prices.
• How inflation expectations are being re-priced
• How the end of the petro-dollar may hit dollar value over the medium to longer term
• How asset correlations are changing
• Where the tail risks lie
• What the outlook and positioning implications are
The coordinated US-Israeli strikes on Iran that commenced on 28 February, 2026, including the killing of Supreme Leader Ali Khamenei, have unleashed the most significant disruption to global energy supply chains since the 1973 oil embargo. Within days, Iran’s Islamic Revolutionary Guard Corps (IRGC) declared the Strait of Hormuz closed, tanker traffic dropped to near zero, and the conflict metastasised across the Gulf, with Iranian retaliatory strikes hitting energy infrastructure in Qatar, Saudi Arabia, Bahrain, and Kuwait. What was initially dismissed by markets as a brief geopolitical flare-up has rapidly evolved into something more structurally concerning, with no clear timeline for normalisation.
Iran is not fighting this conflict on conventional terms. Its strategy, as Chatham House’s Iran specialist Sanam Vakil has observed, is to play for time: dragging the conflict out, spreading costs across as many parties as possible, and forcing the US, Israel, and regional actors to drain their resources until a negotiated path to the Islamic Republic’s survival can be secured. Low-cost asymmetric capabilities, drones manufactured by the tens of thousands, sea mines deployed from fishing boats and precision strikes on civilian infrastructure across Gulf states have proven sufficient to hold the Strait effectively closed while Iran’s conventional military capabilities are progressively degraded. More than four weeks into the conflict, that capacity to inflict damage on soft targets remains meaningfully intact. Understanding this asymmetry is an important analytical input for any investor attempting to model the conflict’s duration and resolution path. The Strait of Hormuz is not just an energy chokepoint. It is a mirror held up to the fragility of the assumptions underlying three decades of globalisation.
Oil, LNG & fertilisers
The pre-crisis setup in oil was, paradoxically, one of abundance. Oil markets entered 2026 with expectations of a balanced-to-oversupplied year, with OPEC+ production increases of 206,000 b/d already approved and non-OPEC supply, led by the US, Brazil, Guyana, and Canada, growing robustly. That comfortable backdrop has been upended.
The front end of the Brent curve reflects acute near-term fear: the June – December Brent spread widened from $3.50 to $9 per barrel within days of the initial strikes. The Centre for Strategic and International Studies (CSIS) analysts have noted the market could be mispricing the risk of a prolonged conflict, particularly given damaged infrastructure that will not restart at the flick of a switch, including the targeted Ras Tanura refinery in Saudi Arabia and Qatar's Ras Laffan complex.
Although the key focus for many analysts and observers has been the surge in oil prices, what has been happening to the Liquified Natural Gas (LNG) market, may be much worse as it may prove even more structurally significant. QatarEnergy's declaration of force majeure at the Ras Laffan facility, the world's largest LNG liquefaction complex and responsible for one fifth of global LNG supply was a seismic event. Asian LNG spot prices more than doubled to $25.40 per million British thermal units (MMBtu) on 4 March, reaching three-year highs. European Title Transfer Facility (TTF) prices surged nearly 70% - 100% in the opening days of the conflict and now trade more than 90% above pre-war levels at €61 per megawatt-hour (MWh), prices that incentivise maximum gas-to-coal switching in power generation but remain insufficient to drive switching from gas into oil products. Europe entered 2026 with gas storage at 46 billion cubic metres (bcm), well below 2025’s 60 bcm and 2024’s 77 bcm entry, leaving it acutely exposed at the worst possible moment in the seasonal refill calendar. China, Japan, India, and South Korea collectively account for 75% of oil and 59% of LNG exports from the Middle East region and their vulnerability is clear. Japan and South Korea, with deep structural reliance on imported LNG for power generation, in Japan’s case accounting for the majority of utility fuel mix, face an acute near-term crunch; governments in both countries are expected to coordinate emergency procurement and, potentially, demand-reduction protocols.
The fertiliser complex offers a third vector of disruption that may be receiving insufficient attention. Natural gas is the primary feedstock for nitrogen fertiliser production. European and Asian ammonia and urea producers, already operating under structurally elevated gas costs since 2022 following Russia’s invasion of Ukraine, now face input cost spikes that threaten production economics.
But the inflation transmission does not stop with fertilisers. This is, at its core, an energy-centric shock, but one that reverberates across the entire cost structure of the modern food system in ways that are only beginning to surface in the data and will not fully appear in earnings for another quarter or two. Petrochemicals derived from oil and gas are the raw material for the plastics and packaging that move every food product from the farm gate to the retail shelf. The Gulf region accounts for meaningful shares of global chemical exports: Qatar and the UAE together supply more than twenty percent of global sulfur exports that are widely used as an agricultural nutrient to improve crop quality and increase yields. The Eastern Saudi Arabia petrochemical corridor contributes significantly to global polyethylene and methanol supply, crucial for producing packaging materials and as a feedstock, with the region collectively accounting for over fifteen percent of global methanol trade.
A disruption that simultaneously pushes up energy costs, fertiliser input prices, and packaging material costs creates what amounts to a double-whammy for the food components of consumer price indices: the effect is not a single pass-through but a compounding one, with each link in the supply chain adding margin pressure and passing it forward. With spring planting season approaching in the Northern Hemisphere, any sustained disruption to fertiliser availability or affordability feeds into agricultural commodity prices and adds a further layer to the global inflation impulse. China is widely expected to tighten fertiliser export controls, further constraining global supply at the worst possible seasonal moment. This secondary inflation channel, food inputs beyond energy, has received far less analytical attention than oil prices, but may ultimately prove more persistent in CPI data.
Can you fix a broken pipeline?
The question is not rhetorical. The five prior largest oil supply shocks including the Iran-Iraq War, Gulf War I, Gulf War II, the Libyan Civil War and Russia's invasion of Ukraine, all share a sobering common pattern: Goldman Sachs research shows that oil production in affected countries four years after the shock remains, on average, more than 40% below pre-shock normal levels. The causes are varied, damage to physical infrastructure, the collapse of investment, the departure of skilled workforces, and the erosion of institutional knowledge. The pattern is consistent and instructive. Energy infrastructure, once damaged at scale, does not recover quickly or cheaply.
Qatar’s Ras Laffan facility is the clearest illustration of this dynamic. QatarEnergy’s CEO has publicly indicated that the facility will require between two and three years to restore full LNG production capacity following the missile damage sustained. Gulf oilfields that have been shut in face analogous restart challenges: sub-sea infrastructure, rotating equipment, and facility processing units all require careful inspection before resumption. Roughly twenty five percent of the region's crude oil is produced offshore, where engineering and geological complexity requires significantly longer ramp-up times than onshore production. The disruption across the GCC is a structural impairment whose full magnitude is still being assessed.
Demand destruction is already underway, even if it has not yet been fully captured in asset prices. In Europe, gas-to-coal switching has accelerated at the margin of the power stack as TTF prices render gas-fired generation uneconomic. LNG spot cargo rationing is effectively functioning as a price mechanism, allocating available supply to the highest bidder. Industrial demand destruction in Europe and Asia is still in the early stages, but clearly directional. US consumer demand destruction is also underway. Retail gasoline prices have increased from about $3 to $4 per gallon at the time of writing. This erodes real purchasing power and consumer sentiment. US policy relief is cosmetic. The International Energy Agency’s coordinated Strategic Petroleum Reserve (SPR) release of 172 million barrels over 120 days, alongside sanctions relief extended to Russian and Venezuelan crude, provides only a marginal buffer as it is insufficient to replace the 17.6 mb/d of lost Persian Gulf flows.
A primer on utilities across the US, Europe and Japan
The relationship between Utilities and energy commodities varies sharply across the US, Europe, and Japan, driven by fuel mix and regulatory design. In the US, investor-owned utilities are largely shielded from commodity volatility through fuel adjustment clauses that pass gas cost changes to ratepayers — making Henry Hub the key benchmark to watch, but not earnings-threatening. Henry Hub is a natural gas pipeline interchange in Louisiana that serves as the primary pricing point for US gas futures on the NYMEX; it reflects domestic supply and demand and has historically traded at a significant discount to global gas prices. Oil plays almost no direct role in US utility costs. Although LNG isn't a direct input for most utilities, the growth of US LNG exports has tied Henry Hub more closely to global gas markets than before. The exception is competitive/merchant generators, whose spark spread margins move directly with gas prices.
Europe and Japan carry far more direct exposure. European utilities operate in liberalised markets where gas-fired plants set the marginal clearing price for the entire grid. This means that TTF (Title Transfer Facility, the Dutch virtual trading hub that serves as Europe's dominant natural gas benchmark) movements flow through to earnings via the spark spread, affecting even renewables and nuclear operators who receive the gas-cleared price without bearing the fuel cost. Unlike Henry Hub, TTF reflects a market deeply dependent on imports such as pipeline flows from Norway and North Africa, and, increasingly LNG, making it far more sensitive to geopolitical disruptions, as the post-2022 price spike illustrated. Japan is the most commodity-exposed of the three: its regional utilities rely on LNG for the bulk of their generation and many long-term supply contracts are priced against the JCC (Japan Customs-Cleared crude price). This is essentially a basket of crude oil import prices into Japan used as the reference for oil-indexed LNG contracts. This creates a direct mechanical link between Brent and Japanese utility costs that neither Henry Hub nor TTF replicates — the latter two are pure gas-on-gas benchmarks, while JCC ties gas procurement costs to crude oil movements with a 3 – 6 months lag. A weaker yen compounds Japan's exposure further since LNG is priced in dollars. Both European and Japanese utilities require active hedging analysis in a way that most regulated US utilities do not.
The European Commission is expected to dust off its 2022-era gas demand reduction playbook, including mandatory storage refill targets and inter-member-state solidarity mechanisms. In the UK, the crisis has reopened the political debate on the Energy Profits Levy, the windfall tax on North Sea producers, with some voices arguing for reform to incentivise increased domestic output, though analysts caution that meaningful incremental production is a multi-year prospect, not a 2026 solution.
In the near term, Japanese utilities will be competing aggressively with European buyers for available spot cargoes, a dynamic that will sustain elevated prices across both markets. The yen, already weakened by the Bank of Japan’s (BoJ) cautious normalisation path, faces additional depreciation pressure as higher import costs widen Japan's energy trade deficit, complicating the BoJ's already delicate policy calculus.
Re-pricing of inflation expectations and stress testing the petrodollar
The crisis is forcing a real-time repricing of inflation expectations across every major economy. Federal Reserve rate cut expectations have faded entirely for the remainder of the year, according to CME Group’s FedWatch tool. European Central Bank (ECB) rate trajectory expectations swung from easing to tightening within a single trading day and now anticipate an ECB deposit facility rate of 2.70% by September, assigning a 64.0% likelihood to a rate hike at the 29th April meeting, according to the ECB Watch Tool. Bank of England (BoE) policymakers are now debating whether to treat this as a ‘temporary blip’, as they did with energy-driven inflation in the early 2010s, or whether the post-2022 experience demands a more aggressive response.
Are investors hostages to the dollar? In a meaningful sense, yes. The US' structural position as the world's largest energy producer and net exporter means its economy is relatively insulated from the supply shock. Additionally, the dollar retains its primacy in global energy pricing, trade settlement, and crisis liquidity. When risk flares, institutional investors and sovereign entities alike bid for dollar liquidity. The energy shock, which is priced in dollars, intensifies demand for the currency even as it undermines US growth prospects. This asymmetry gives the dollar a fundamental advantage that is difficult for competing safe havens to match. However, this advantage may only be temporary and is contingent on the length of the war with Iran as fiscal costs mount and geopolitical goodwill is depleted.
The petrodollar is, at its core, a geopolitical arrangement as much as an economic one. In 1974, the US and Saudi Arabia struck a deal whereby Saudi Arabia agreed to price its oil exports in US dollars and recycle the resulting surpluses into US Treasury securities, in exchange for American security guarantees and military protection, an arrangement that the rest of the Gulf Cooperation Council (GCC) subsequently adopted. Because oil is the foundational input to global manufacturing, transport, and petrochemical production, its universal pricing in dollars created a powerful structural incentive for global value chains to dollarise: companies priced their goods in the currency of their key input cost, banking systems intermediated in dollars, and central banks accumulated dollar reserves to serve as effective lenders of last resort.
The foundations of this arrangement were under quiet, but significant pressure even before the current conflict began. The US shale revolution rendered America energy-independent, fundamentally altering the logic of the original security-for-oil-pricing bargain: Saudi Arabia now sells more than four times as much crude to China as it does to the US, and eighty-five percent of Middle East crude production is destined for Asia. Under Vision 2030, Saudi Arabia had already been pursuing defence localisation, targeting fifty percent domestic content in military spending. It had also joined Project mBridge, a blockchain-based payment infrastructure initiative involving the central banks of China, the UAE, Saudi Arabia, Thailand, and Hong Kong that facilitates transactions in each country’s digital currency without recourse to dollar correspondent banking or SWIFT.
The current conflict has exposed these latent fault lines with unusual force. US military assets and bases in the Gulf have come under direct attack and oil infrastructure has been struck. The US ability to guarantee the maritime security underpinning global oil transit has been visibly tested with the closure of the Strait of Hormuz. The conflict could be the catalyst for the beginnings of what Deutsche Bank has termed the 'petroyuan', a fracture of global oil pricing along trade corridors, with Middle East oil flowing to Asia priced in yuan, while Western Hemisphere oil crosses the Atlantic in dollars.
This does not mean the dollar's displacement is imminent or inevitable. US energy independence confers a genuine safe-haven quality in the current shock. The US is the only major economic region that is both, energy self-sufficient and geographically remote from the conflict, giving it a relatively more ambiguous and likely less negative growth impact than energy-importing peers. However, the war has introduced pressures that could force GCC economies to redeploy dollar savings domestically to support war-damaged local economies, lowering the hurdle to further currency realignment, and broader erosion of geopolitical goodwill. In light of persistent fiscal deficits, the increasing burden of US national debt, and the reduction in tariff revenues following the Supreme Court’s decision declaring most IEEPA-imposed tariffs unconstitutional, the dollar could come under meaningful pressure once the conflict provides clearer resolution visibility. Other central banks will likely continue to diversify away from the US dollar over the medium to longer term as these structural pressures compound alongside rising geopolitical risks and demonstrated willingness to weaponise the dollar. These are multi-year headwinds. For multi-asset investors with a longer horizon, the dollar’s structural endowment is less secure than it appeared twelve months ago.
Asset correlations: the playbook gets rewritten
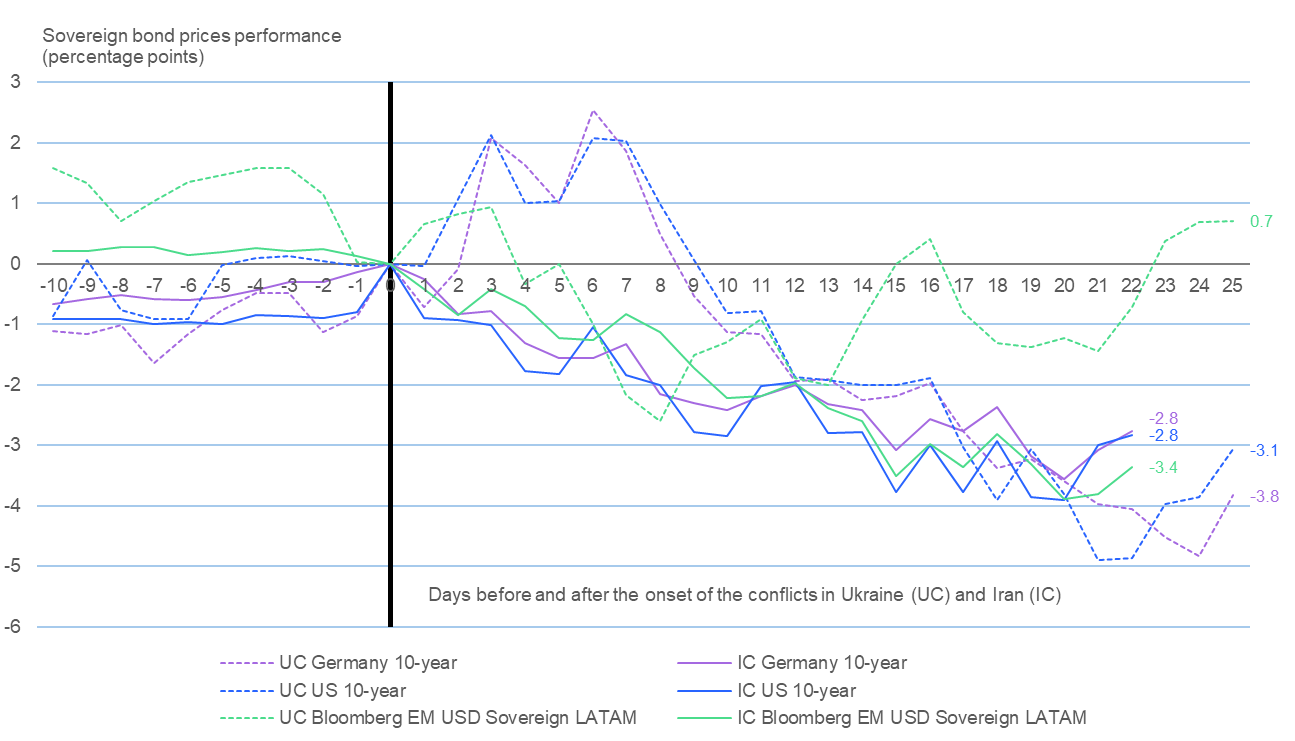
Perhaps the most interesting dimension of this episode is what it reveals about asset correlations. The textbook response to a major geopolitical shock has historically involved a flight to safety: bonds rally as investors seek duration, gold rises as a store of value and equities sell off. The present episode exhibits greater complexity and poses increased challenges for multi-asset allocators.
The bond market's response has reflected the extent of the move toward a risk-off sentiment. The 10-year US Treasury yield rose from 3.952% at the end of February to 4.318% by the end of March, a 36.6 bps increase. At the longer end, the 30-year yield climbed to 4.914%. Bonds are selling off, not rallying, because investors are pricing the inflationary consequences of the oil shock ahead of the safe-haven demand. Investors now anticipate a period characterised by accelerated inflation, subdued economic growth, and heightened vulnerability in the labour market. This stagflationary environment renders bonds ineffective as either a hedge against growth risks or a safeguard against rising prices. This represents a breakdown of the traditional negative bond-equity correlation that anchored portfolio construction throughout most of the post-GFC era.
Gold's behaviour has been equally revealing. Spot gold initially surged from $5,296 to $5,423 per troy ounce in the aftermath of the initial strikes, consistent with its safe-haven playbook. However, it experienced a subsequent sell-off that drove prices to $4,699.60 at the end of March, a decline of 11.27% throughout the month. During the initial phase of a crisis of this scale, investors often encounter liquidity shortages, margin calls, and compelled asset sales. It was this liquidity-driven deleveraging along with profit taking after the strong performance in January and February, that saw its decline in March.
The phenomenon is not new; similar dynamics were observed during the early stages of the COVID shock in March 2020 and the 2022 Russia-Ukraine escalation. However, the medium-term structural case for gold remains compelling, driven by central bank diversification away from US Treasuries, ETF inflows, and the inflation hedge premium.
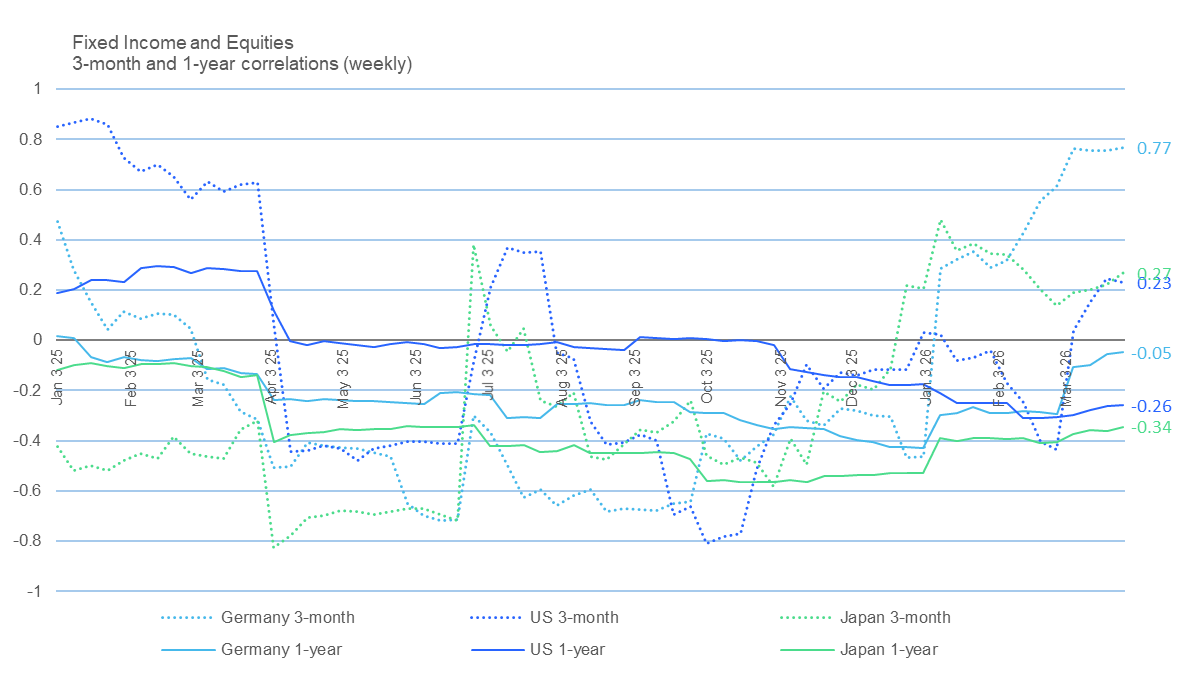
The rolling correlation data provides perhaps the starkest illustration yet of the regime shift underway. Across Germany, US, and Japanese markets, 3-month bond-equity correlations have surged sharply into positive territory since the onset of the conflict: Germany now reads 0.77, Japan 0.27, and the US 0.23, a dramatic reversal from the deeply negative readings, some approaching -0.80, that prevailed through much of 2025. This is precisely the dynamic that makes stagflationary environments so destructive to multi-asset portfolios: when bonds and equities sell off in tandem, the diversification benefit that underpins conventional 60/40 construction simply disappears.
Notably, the 1-year correlations tell a different story. They are still negative at -0.26 for the US, -0.34 for Japan, and -0.05 for Germany because they carry the longer historical memory of the prior disinflationary regime. The gap between short- and long-horizon readings is itself a signal worth watching: the market is in transition, and whether the 3-month regime hardens into a new structural baseline will depend on how persistent the inflationary impulse from the oil shock proves to be. For allocators running liability-driven or risk-parity frameworks calibrated to negative bond-equity correlations, the current environment threatens to overturn a foundational portfolio construction assumption.
Source: Factset, Exante Research
Signal lives in the ‘on the ground’ details, not the headlines
Markets have increasingly learned to discount the rhetorical cadence of the US President, whose statements about the conflict’s timeline have repeatedly exceeded their stated durations without delivering corresponding progress. The boy-who-cried-wolf dynamic has real costs. Each iteration of an imminent resolution that fails to materialise erodes the market-moving power of each successive announcement. When Washington insists the war is almost over while the Strait remains closed and the IRGC continues to operate, investors risk pricing a fading narrative rather than a reality.
Chatham House’s Sanam Vakil and former US Middle East advisor Ambassador Dennis Ross converge on a view that deserves more weight than markets have yet assigned it: this conflict will not end simply because the US or Israel decide it should. Tehran views the conflict as nothing less than an existential struggle, drawing on the lessons of the 2025 Twelve-Day War, which Iran felt it conceded too early, a premature capitulation that it believes signalled weakness and invited this more direct challenge. The corollary for investors is that the duration of this conflict is a function of political conditions and incentives that have yet to be met, not merely a function of military attrition.
Even a negotiated ceasefire would not flip a switch restoring flows; it would be the beginning of a trust-rebuilding process that shipping, insurance, and LNG companies would need to validate over time before resuming normal operations.
Beyond Kharg Island, which has received considerable attention as a potential US leverage point given that Iran routes the majority of its crude exports through the island’s terminal, there are additional pressure points that investors should track. The US could move to interdict the 'shadow fleet' of carriers on either side of the Gulf. The US Marine Expeditionary Unit currently en route to the Middle East opens the door to the occupation of Iranian coastal islands or strategic littoral positions that would deny the IRGC the ability to threaten shipping without a direct military cost. China, which depends on Middle Eastern energy and has watched its Asian partners face acute supply disruption, represents perhaps the most underappreciated pressure point: the moment the US makes clear that Iran will not be permitted to export if it continues to prevent others from doing so, Beijing has strong incentives to apply pressure to Tehran’s cost-benefit calculations.
The NACHO dynamic, an acronym coined by strategist Jim Bianco for ‘Not Actually Changing Hormuz Opening’, can be a useful shorthand for the gap between stated progress and observable reality in the Strait. You cannot predict TACO, but you can follow whether any given event or development actually changes the NACHO dynamic. Until the tanker count shows a sustained directional change, the structural supply disruption remains intact, irrespective of whatever diplomatic choreography is playing out at the surface.
Underappreciated tail risks
The first tail risk is duration. The US President has alluded to a ‘four-to-six-week period’ as the timeline for sustainable negotiations and a ‘pragmatic’ successor regime in Tehran. History suggests regime-change timelines are rarely linear or predictable. The 2003 Iraq analogy is sobering: power vacuums following the removal of entrenched leadership structures tend to produce prolonged instability, not swift regime change. An Iran conflict extending into the summer would put unprecedented pressure on global energy markets heading into autumn, when European storage refill operations typically end and Asian demand peaks.
The second tail risk is infrastructure damage. Rystad Energy’s analysis underscores that even after a ceasefire, some assets may be restored within months, but others could remain offline for years. Beyond the status of the Strait of Hormuz, every day of damaged or shut-in infrastructure pushes pre-war production capacity further out of reach. Qatar’s Ras Laffan facility is expected to require at least two to three years to return to normal LNG production. If infrastructure damage is more severe than currently assessed, the supply constraint could persist well into 2027, permanently repricing global energy markets in a way that would be structurally inflationary across a multi-year horizon. The historical evidence deserves more weight than it is currently receiving in market pricing.
The third tail risk is the Russia beneficiary dynamic. As CSIS and Kpler analysts have noted, the conflict materially improves Russia’s competitive position in global crude markets. India and China, both facing acute near-term supply pressure from the Gulf disruption, have strong incentives to deepen reliance on Russian crude, available at a discount and logistically accessible. This dynamic risks entrenching an alternative energy architecture that bypasses Western-controlled price benchmarks and trade routes, with long-run implications for the geopolitical leverage embedded in dollar-denominated energy markets.
The fourth, and perhaps most underappreciated, tail risk is the scarcity re-pricing of energy infrastructure assets. After 2022, European energy infrastructure was permanently re-rated: investors assigned structurally higher multiples to LNG terminals, gas pipelines, and power grid assets that had previously been valued as utility-grade, low-growth businesses. If the current crisis confirms that Gulf LNG supply is a persistent strategic vulnerability, a similar re-rating of non-Gulf LNG supply chains, US export capacity, East African LNG and Australian volumes, may be underway. That is a structural trade, not a momentum one, and it operates on a different time horizon than the near-term geopolitical positioning that currently dominates market attention.
Outlook and positioning implications
The current rate-market pricing requires careful distinction between the direction of the policy shock and its magnitude. Interest rate expectations have shifted decisively since the conflict began, moving from pricing meaningful easing across the Fed, ECB, and BoE, to implying outright rate hikes; in the case of the ECB and BoE, as soon as April. That repricing was directionally appropriate. An energy-driven inflation shock of this magnitude warrants central bank caution and a more constrained outlook for rate cuts. However, the sheer magnitude of the market’s reaction in Europe appears excessive in the absence of clear evidence that higher energy prices are feeding through into underlying core inflation. Central bank communication has underscored this caution. BoE Governor Andrew Bailey explicitly cautioned against strong conclusions on rate hikes, while Bundesbank President Nagel argued for a wait-and-see approach given the difficulty of assessing medium-term implications. For investors, this creates a positioning asymmetry: the front end of developed market yield curves has repriced aggressively enough that short-duration, high-quality exposure, particularly US Treasuries in the zero-to-three-year segment, now may offer attractive income without requiring a view on the terminal rate, the long-end duration risk that remains exposed to fiscal concerns, or the credit risk embedded in Emerging Markets (EM) fixed income.
The more structurally exposed asset class, in the context of a protracted energy shock, is EM fixed income. EM debt spreads, currently in the tightest decile of the past fifteen years, appear particularly vulnerable to repricing in a prolonged energy shock environment. In this scenario, diminishing growth prospects and escalating energy-driven inflation in developed markets are likely to raise interest rate expectations, further increasing the vulnerability of EM fixed income. During the Russia-Ukraine conflict, EM spreads widened more than 300 bps from comparable starting levels. This historical precedent can serve as a valuable reference for determining current allocation sizes. However, it is important to note that EM fiscal fundamentals in 2026 are considerably stronger than they were in 2022, something that should be considered when making allocation decisions.
Source: Factset, Exante Research
In US equities, the key distinction is between earnings durability and earnings sensitivity. US large-cap equities continue to offer the most compelling quality characteristics in the current environment: higher operating margins, stronger balance sheet positions, greater FCF generation, and broader revenue diversification relative to their smaller-cap counterparts. Large-cap companies have demonstrated greater ability to absorb higher input costs through pricing power and operational scale, attributes that can strengthen a portfolio’s resilience as the energy shock works its way through supply chains with a lag. US small caps, by contrast, face a compounding challenge: a meaningful portion of the universe carries floating-rate debt obligations, creating direct earnings sensitivity to the very rate environment that the inflation shock is producing. Until financing conditions ease or domestic growth shows a sustained reacceleration, the risk-reward in small caps seems asymmetrically unfavourable relative to higher-quality market segments.
In EM equities, selectivity, or active management, is paramount. Brazil is the clearest equity market beneficiary: as a net energy exporter with an equity index carrying meaningful energy sector weighting, higher oil and commodity prices directly support earnings revisions and currency performance. South Korea and Taiwan present a more nuanced case, both are energy importers exposed to the terms-of-trade shock, but both continue to exhibit strong underlying earnings fundamentals that benefit from accelerated data-centre investment by sovereigns and corporates seeking more domestically resilient computational infrastructure, where order books and revisions momentum remain constructive. India, South Africa, and central European markets face more challenging conditions, where the combination of higher energy import costs, inflation sensitivity, and potential monetary policy tightening creates meaningful headwinds to near-term earnings.
The overarching portfolio principle for this environment is layered resilience rather than a single directional bet. The energy shock has not produced a uniform repricing; it has created a mosaic that rewards deliberate positioning over broad market beta. Quality attributes, balance sheet strength, and earnings durability are characteristics most likely to generate resilient returns across a range of conflict duration scenarios. The playbook has been rewritten; the question is whether investors are reading the new version.
Ten artykuł jest publikowany wyłącznie w celach informacyjnych i nie powinien być traktowany jako oferta lub zachęta do kupna lub sprzedaży jakichkolwiek inwestycji lub powiązanych usług, do których można się tu odwołać. Obrót instrumentami finansowymi wiąże się ze znacznym ryzykiem strat i może nie być odpowiedni dla wszystkich inwestorów. Wyniki osiągnięte w przeszłości nie są wiarygodnym wskaźnikiem wyników w przyszłości.


Zarejestruj się i otrzymuj informacje rynkowe
Zarejestruj się i otrzymuj
informacje
rynkowe
Subskrybuj teraz


Stworzone przez profesjonalistów. Dla profesjonalistów.
