
Will US oil majors deploy more CapEx?

Key data to move markets today
EU: European Commission's Business Climate, Consumer Confidence, and Economic Sentiment Indicator, German CPI and German Harmonised Index of Consumer Prices
US: Speeches by Fed Chair Jerome Powell and New York Fed President John Williams
JAPAN: Tokyo CPI, Tokyo Core CPI, Large Retailer Sales and Retail Trade
CHINA: NBS Manufacturing PMI and Non-Manufacturing PMI
Global Macro Updates
Dallas Fed Energy Survey. Activity within the oil and gas sector increased during Q1 2026, as reported by executives participating in the Dallas Fed Energy Survey. The business activity index, which serves as the broadest gauge of conditions faced by energy firms in the Eleventh District, turned positive, rising from -6.2 in Q4 2025 to 21.0 in Q1 2026.
The company outlook index also shifted into positive territory, advancing from -15.2 in the previous quarter to 32.2 in Q1, indicating a more optimistic perspective among firms. However, the outlook uncertainty index remained elevated, increasing from 43.4 to 53.7.
Oil and gas production experienced minimal change over the quarter, according to executives at exploration and production companies. The oil production index edged upward from -3.4 to 0, while the natural gas production index rose slightly from 0 to 2.3.
Costs grew at a somewhat faster rate compared to the prior quarter. The input cost index for oilfield services firms climbed from 24.4 to 34.9. Among exploration and production companies, the finding and development costs index increased from 5.7 to 22.3. The lease operating expenses index remained relatively stable at 30.0.
Oilfield services firms reported modest improvements across nearly all indicators, marking a notable change from the previous quarter. The equipment utilisation index for oilfield services firms turned positive, surging from -12.2 to 30.2. The operating margin index, while still negative, improved from -31.7 to -7.0, suggesting margins were compressed at a slower pace. Additionally, the prices received for services index rose from -30.0 to 9.3.
Overall demand for employees remained unchanged, yet those employed worked more hours than in the prior quarter. The aggregate employment index moved from -10.8 in Q4 to 0.8 in Q1, while the aggregate employee hours index increased from -9.3 to 12.8. Furthermore, the aggregate wages and benefits index rose from 6.2 to 23.5.
WTI crude oil is forecast to reach $74 per barrel by year-end, $73 per barrel two years out, and $79 per barrel in five years. For Henry Hub natural gas, projections are $3.60 per million British thermal units (MMBtu) at year-end, $4.03 in two years, and $4.42 in five years.
US Stock Indices
Dow Jones Industrial Average -1.73%
Nasdaq 100 -1.93%
S&P 500 -1.67%, with 8 of the 11 sectors of the S&P 500 down
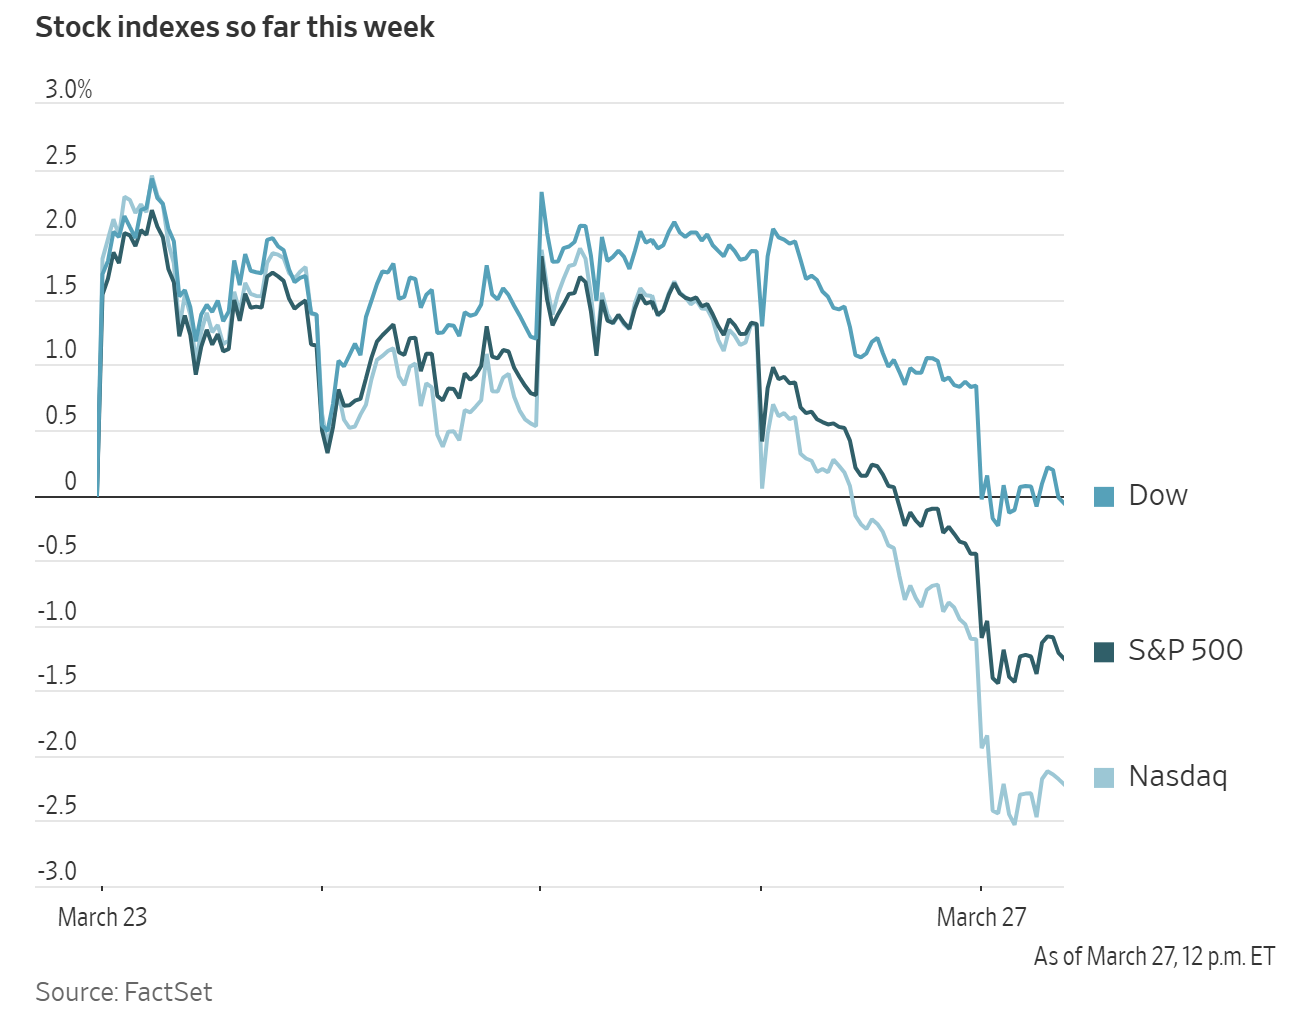
A deepening sell-off on Friday led to all three major equity indices closing in negative territory. The S&P 500 fell for the fifth consecutive week, reaching its lowest level since August. This five week losing streak marks its worst performance since the onset of the Russia-Ukraine conflict in 2022. The Dow Jones Industrial Average and the Nasdaq Composite have moved into correction territory. The Nasdaq Composite was down for a tenth week out of the past 11 and was down over 12% on Friday from its October peak.
The Dow Jones Industrial Average declined -1.73%, losing 793.46 points. The Nasdaq Composite fell -2.15%, while the S&P 500 retreated -1.67%.
Over the past week, the S&P 500 lost -3.22%, the Dow Jones Industrial Average fell -2.25% and the Nasdaq Composite dropped -4.55%.
In corporate news, Anthropic PBC is reportedly considering an IPO as early as October, according to a report by Bloomberg news that cited individuals familiar with the matter. The AI firm is seeking to go public as it competes with OpenAI.
Oaktree Capital Management has announced it will honor all redemption requests for its $7.7 billion private credit fund targeted at retail investors, aligning with other managers who have opted not to impose caps on withdrawals.
Shares of Pernod Ricard, the Paris-based producer of Absolut vodka, rose following a report from The Wall Street Journal indicating the company is engaged in merger discussions with Brown-Forman, the Louisville, Kentucky-based maker of Jack Daniel’s.
Norwegian Cruise Line announced its intention to restructure its board of directors following the resolution of a dispute with activist investor Elliott Investment Management.
S&P 500 Best performing sector
Energy +1.87%, with Halliburton +4.20%, APA +3.71% and Exxon Mobil +3.36%
S&P 500 Worst performing sector
Consumer Discretionary -3.05%, with Norwegian Cruise Line -6.85%, Airbnb -6.25% and Aptiv -5.51%
Mega Caps
Alphabet -2.94%, Amazon -4.02%, Apple -1.62%, Meta Platforms -4.02%, Microsoft -2.51%, Nvidia -2.17% and Tesla -2.76%
Information Technology
Best performer: First Solar +2.40%
Worst performer: Palo Alto Networks -5.97%
Materials and Mining
Best performer: LyondellBasell Industries +3.51%
Worst performer: Amcor -3.14%
European Stock Indices
CAC 40 -0.87%
DAX -1.38%
FTSE 100 -0.05%
Commodities
Gold spot +2.65% to $4,492.48 an ounce
Silver spot +1.44% to $69.59 an ounce
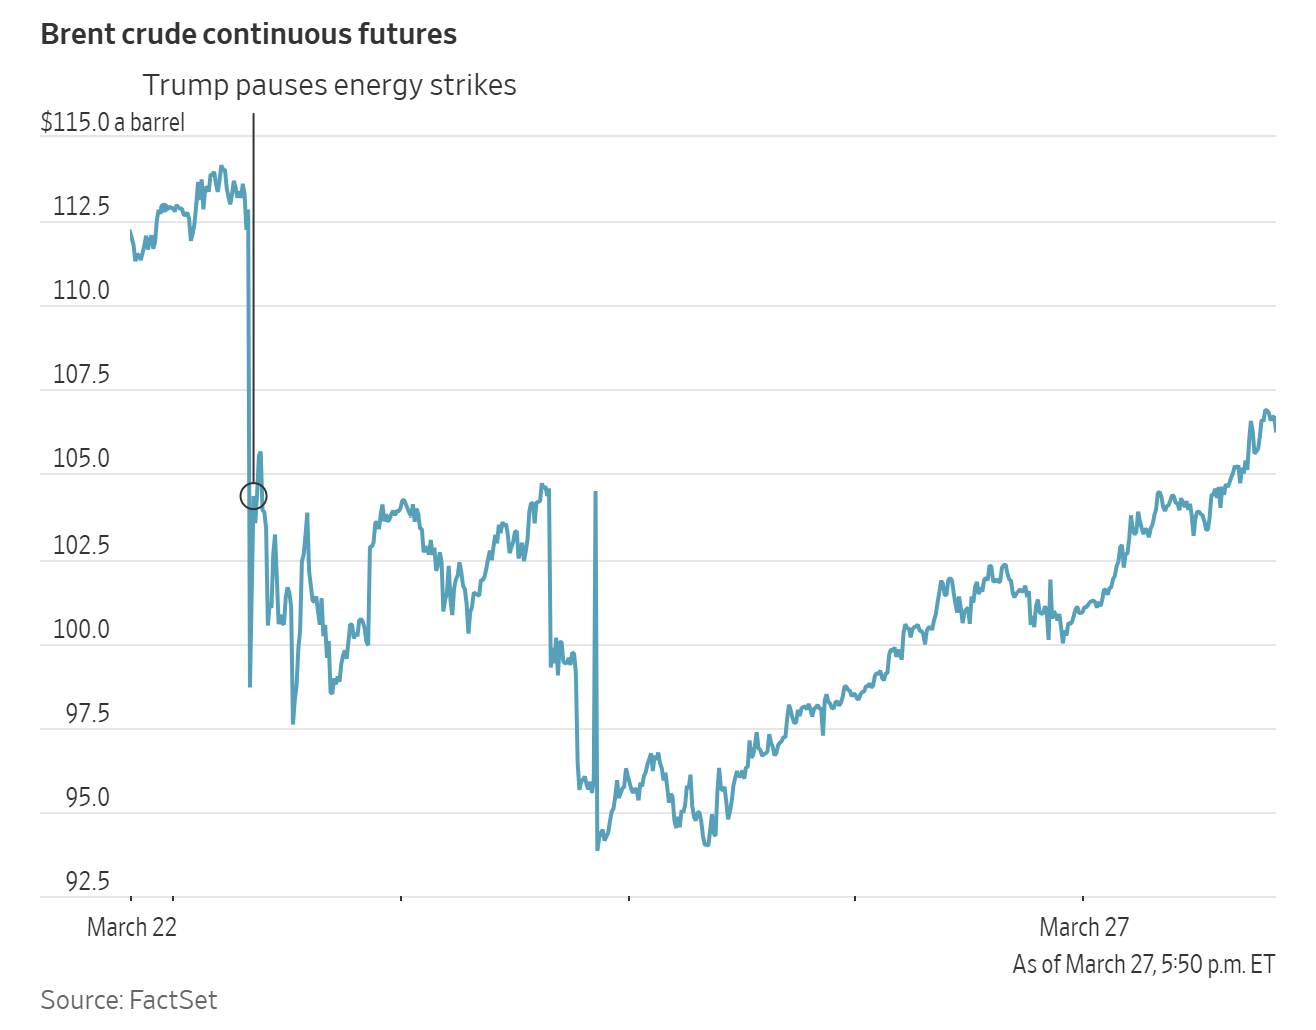
West Texas Intermediate +5.46% to $99.64 a barrel
Brent crude +12.52% to $114.57 a barrel
Gold prices advanced over two percent on Friday, as investors engaged in dip-buying following a retreat earlier in the week.
Spot gold ended the trading day +2.65% to $4,492.48 per ounce after climbing as high as $4,554.39 earlier in the trading session.
Last Monday, spot gold hit a four-month low of $4,097.99. Over the week, gold edged +0.11% higher. It has declined -15.18% since the outbreak of conflict in the Middle East.
Spot silver rose +1.44% to $69.54 per ounce on Friday, marking a +2.70% gain for the week.
Oil prices climbed on Friday, securing gains for the week, as market participants remained skeptical regarding the likelihood of a ceasefire in the ongoing Iran conflict.
Brent crude futures advanced by $12.75, or +12.52%, to close at $114.57 per barrel. US WTI futures increased by $5.16, or +5.46%, settling at $99.64 per barrel.
Since 28 February, the day US and Israeli forces initiated strikes against Iran, the Brent benchmark has surged +56.50%, while WTI has risen +48.08%. For the week, Brent posted a gain of +4.58%, whereas WTI edged up +0.84%.
Market sentiment remains cautious, particularly in response to statements from the US President regarding the Iran negotiations. An Iranian official informed Reuters that a US proposal, relayed to Tehran via Pakistan, was considered one-sided and unfair.
The US President has extended his deadline for Iran to reopen the Strait of Hormuz, warning of potential destruction of Iran’s energy infrastructure should compliance not be met. In addition, the US has deployed thousands of troops to the Middle East, and discussions are reportedly underway about the possible use of ground forces to seize Iran’s key oil facility on Kharg Island. In an interview with the Financial Times on Sunday, President Trump said his “preference would be to take the oil”, comparing the potential move to Venezuela where the US intends to control the oil industry “indefinitely” following its capture of strongman leader Nicolás Maduro in January. As noted by the Financial Times, the Pentagon has ordered the deployment of 10,000 troops trained to seize and hold land. About 3,500 troops arrived in the region on Friday, including roughly 2,200 Marines. Another 2,200 Marines are en route, while thousands of troops from the 82nd Airborne Division have also been ordered to the region.
The ongoing conflict has removed approximately 11 million barrels per day from the global oil supply. The International Energy Agency has described this situation as more severe than the oil shocks experienced in the 1970s.
Additionally, Russian oil producers have notified buyers of the potential declaration of force majeure on exports from major Baltic Sea ports, following recent Ukrainian attacks on Russian energy infrastructure.
Note: As of 4 pm EDT 27 March 2026
Currencies
EUR -0.29% to $1.1500
GBP -0.57% to $1.3255
Bitcoin -4.14% to $66,014.45
Ethereum -3.69% to $1,984.34
The US dollar strengthened broadly due to elevated safe-haven demand, rising expectations for a US interest rate hike this year as well as favourable terms of trade in commodity pricing, amid the escalating conflict in the Middle East and diminishing prospects for de-escalation.
The dollar index rose +0.27% to 100.19, marking a weekly gain of +0.70% and a cumulative increase of +2.60% in March MTD, positioning it for its strongest monthly performance since July 2025.
The euro declined -0.29% to $1.1500 on Friday, while the British pound weakened for the fourth consecutive session, falling -0.57% to $1.3255. For the week, the euro was -0.33%, and the pound -0.34%.
The yen depreciated -0.42% against the dollar, reaching ¥160.31 and surpassing the ¥160 threshold for the first time since July 2024, when Japanese authorities previously intervened to support the currency. Earlier today, as noted by Bloomberg news, Atsushi Mimura, vice finance minister for international affairs, said that “If this situation continues, we believe decisive action may soon be necessary.”
Last week, the yen declined -0.68%, pressured by another increase in Japanese bond yields following new estimates from the BoJ regarding its neutral rate. These estimates indicate that policymakers are prepared to raise interest rates to address inflation. Japan’s substantial dependence on imported energy renders it more vulnerable to rising prices than many other major economies.
Fixed Income
US 10-year Bond +1.4 basis points to 4.438%
German 10-year +2.7 basis points to 3.103%
UK 10-year gilt +0.6 basis points to 4.922%
On Friday, short-term US Treasury yields declined, while yields on longer-term maturities increased, though the gains were more moderate.
The yield on 10-year Treasury notes rose +1.4 bps to reach 4.438%, after previously touching 4.482%, its highest level since July.
The yield on the 30-year Treasury bond also advanced, at one point approaching 5.0%. It ultimately settled +3.3 bps higher at 4.972%. On the front-end of the curve, the two-year US Treasury yield, highly sensitive to expectations for the federal funds rate, declined -7.2 bps to 3.841%. Earlier in the session, it reached 4.027%, marking their highest level since June.
Throughout last week, the US yield curve shifted upwards across all maturities. The two-year yield increased +1.5 bps, the 10-year yield +5.1 bps and the 30-year yield +2.8 bps.
The spread between yields on two- and 10-year Treasury notes, as measured by the US Treasury yield curve, stood at 51.0 bps, widening by 3.6 bps compared to the previous week's 47.4 bps.
According to CME Group's FedWatch Tool, Fed funds futures traders are pricing in 6.5 bps of rate hikes cuts in 2026, slightly lower than the 6.6 bps priced in the previous week. Fed funds futures traders are now pricing in a 2.1% probability of a 25 bps rate hike at the 29 April FOMC meeting, compared to last week’s 12.4% probability.
Eurozone bond yields reached their highest levels in 15 years on Friday, climbing above 3% as money markets factored in the likelihood of three ECB rate hikes. The ongoing absence of concrete steps toward achieving a ceasefire in the Middle East played a significant role in shaping this movement.
Since the onset of the Iran conflict on 28 February, market participants have intensified their expectations of ECB policy tightening, anticipating swift action from the central bank in response to inflationary pressures driven by rising oil prices.
ECB President Christine Lagarde cautioned that energy disruptions could persist for several years, further increasing pressure on long-term bonds and reinforcing the outlook for prolonged higher interest rates. On Thursday, President Lagarde remarked that expectations for a rapid normalisation may be overly optimistic.
On Friday, traders projected the ECB deposit facility rate would reach 2.70% by September, with a 60% probability of the first rate hike by May. The current deposit rate is 2%, and the next ECB meeting is scheduled for the end of April.
The German 10-year Bund yield increased +2.7 bps to 3.103% after touching 3.130%, marking its highest level since May 2011. Over the past week, the yield rose +5.0 bps.
The German two-year yield has risen +67.5 bps MTD, the most since August 2022. On Friday, it declined -3.1 bps to 2.691% after reaching 2.771%, its highest level since July 2024. It was +1.2 bps higher last week.
Weak demand at recent government bond auctions has further contributed to upward pressure. Bund sales have attracted fewer bids compared to previous months. The most recent 10-year Bund auction on 11 March experienced its weakest demand since October, which itself represented a multi-year low.
Long-term French bonds have also been affected, reflecting France's reliance on energy imports and its comparatively fragile public finances. The French 10-year OAT yield reached its highest level since June 2009 at 3.889%, rising +4.9 bps on Friday to 3.841%. Over the past week, the 10-year OAT yield advanced +8.8 bps.
Italy's 10-year yield ended Friday's session +5.9 bps to 4.070%, contributing to a weekly increase of +10.9 bps. Earlier in the session, the yield touched 4.142%, its highest since July 2024. The spread between Italian and German 10-year yields stood at 96.7 bps, widening to 100 bps earlier in the session, and increased by 5.9 bps over the week.
Note: As of 4 pm EDT 27 March 2026
While every effort has been made to verify the accuracy of this information, EXT Ltd. (hereafter known as “EXANTE”) cannot accept any responsibility or liability for reliance by any person on this publication or any of the information, opinions, or conclusions contained in this publication. The findings and views expressed in this publication do not necessarily reflect the views of EXANTE. Any action taken upon the information contained in this publication is strictly at your own risk. EXANTE will not be liable for any loss or damage in connection with this publication.
Ten artykuł jest publikowany wyłącznie w celach informacyjnych i nie powinien być traktowany jako oferta lub zachęta do kupna lub sprzedaży jakichkolwiek inwestycji lub powiązanych usług, do których można się tu odwołać. Obrót instrumentami finansowymi wiąże się ze znacznym ryzykiem strat i może nie być odpowiedni dla wszystkich inwestorów. Wyniki osiągnięte w przeszłości nie są wiarygodnym wskaźnikiem wyników w przyszłości.


Zarejestruj się i otrzymuj informacje rynkowe
Zarejestruj się i otrzymuj
informacje
rynkowe
Subskrybuj teraz


Stworzone przez profesjonalistów. Dla profesjonalistów.
