
Is Trump worrying about global markets?
Key data to move markets today
EU: Germany GfK Consumer Confidence, Spanish Harmonised Index of Consumer Prices and a speech by ECB Executive Board Member Isabel Schnabel
UK: Retail Sales
US: Michigan Consumer Expectations, Michigan Sentiment Index, UoM 1-year and 5-year Consumer Inflation Expectations, and speeches by Richmond Fed President Thomas Barkin, San Francisco Fed President Mary Daly and Philadelphia Fed President Anna Paulson
Global Macro Updates
OECD flags stagflation risk from Iran shock. The March 2026 OECD Interim Economic Outlook presented the Iran‑driven Middle East conflict as an energy and commodities shock that effectively wipes out the tentative upgrade to global growth while pushing inflation higher in the near term. Global GDP is now projected at 2.9% in 2026 and 3.0% in 2027, with the adverse impact from higher energy and fertiliser prices offsetting the positive impulse from strong technology‑related investment, lower effective US tariffs and better‑than‑expected data through late 2025.
For the US, growth is projected at 2.0% in 2026, easing to 1.7% in 2027, as robust AI‑related investment and productivity gains are gradually outweighed by weaker real income growth and a squeeze on household purchasing power. Headline inflation, however, is now expected to rise to 4.2% in 2026, a 1.2 percentage‑point upward revision from December, driven largely by the surge in oil and gas prices linked to the disruption of flows through the Strait of Hormuz. In the euro area, GDP growth is cut to 0.8% in 2026, from 1.4% in 2025, as higher imported energy costs act as a significant drag on domestic demand; within the bloc, Germany is projected to grow by 0.8%, Italy by 0.4% and Spain by 2.1%, reflecting differences in energy exposure, fiscal space and underlying momentum.
The UK is highlighted as one of the most exposed advanced economies. Growth is expected to be only 0.7% in 2026, while inflation is pushed back up to 4.0%, a 1.5 percentage‑point upward revision relative to the December projections. This combination reflects high dependence on imported energy, the pass‑through from sharply higher wholesale gas prices and tighter domestic financial conditions. Across Asia, large net energy importers such as Japan and Korea face the most acute terms‑of‑trade shock, particularly in the downside scenarios in which LNG availability remains severely constrained. China and India are also affected through higher LNG and fertiliser costs and, in India’s case, targeted energy rationing, which will weigh on industrial output and potentially on agricultural production in 2027.
The transmission channel is overwhelmingly energy‑centric. Brent crude and key gas benchmarks in Europe are now running roughly 40% – 60% above the levels assumed in the December 2025 Outlook, reflecting the near‑halt in shipments through the Strait of Hormuz and damage to critical LNG infrastructure around the Gulf. The shock propagates downstream into refined products, jet fuel and diesel, as well as into fertilisers: prices for urea and other nitrogenous products have risen by more than 40%, raising the risk of weaker crop yields and higher food prices into 2027. The sectors bearing the brunt of this adjustment are transport, petrochemicals, metals and other energy‑intensive manufacturers, where input cost pressures threaten margins and capex, particularly for lower‑margin European and UK cyclicals. At the same time, parts of the global oil and gas complex and net energy‑exporting economies enjoy a material terms‑of‑trade gain, as higher export prices raise incomes and help cushion domestic demand.
For investors, three elements warrant particular attention. First, the policy reaction function has shifted: the OECD now envisages that the Fed, the ECB and the BoE will be forced to keep policy rates higher for longer than previously assumed, in order to prevent the energy‑driven inflation spike from de‑anchoring expectations, even as growth loses momentum. Second, sectoral earnings sensitivity has risen sharply. European and UK transportation, chemicals and energy‑intensive industries look most vulnerable to sustained high input costs and tighter financial conditions, whereas US and Asian technology names leveraged to AI‑driven capex and productivity gains remain the main structural offset to the shock. Third, tighter global financial conditions, higher long‑term yields and episodes of market volatility raise refinancing and default risks for highly leveraged energy users and for parts of the non‑bank credit complex.
In terms of resilience, the US stands out as comparatively robust, combining strong AI‑related investment and a relatively diversified energy base with still‑supportive labour market dynamics. Within Europe, some core economies such as Germany appear better placed to manage the shock thanks to more comprehensive energy‑efficiency measures and defence‑related fiscal support, even if near‑term growth is weak. Net energy exporters in Emerging Markets, including parts of the Middle East and selected commodity‑producing economies, are clear beneficiaries via improved terms of trade and stronger fiscal revenues. On the downside, the UK and energy‑dependent Asian importers such as Japan and Korea are the main outliers, with model‑based scenarios showing outsized hits to output under a prolonged disruption. Among large EMs, Brazil, India and South Africa face a more complex mix of higher fertiliser and food costs and tighter global financial conditions, though some receive partial compensation through higher commodity export prices and, in several cases, from lower US bilateral tariffs that support trade and investment flows.
US Stock Indices
Dow Jones Industrial Average -1.01%
Nasdaq 100 -2.38%
S&P 500 -1.74%, with 4 of the 11 sectors of the S&P 500 down
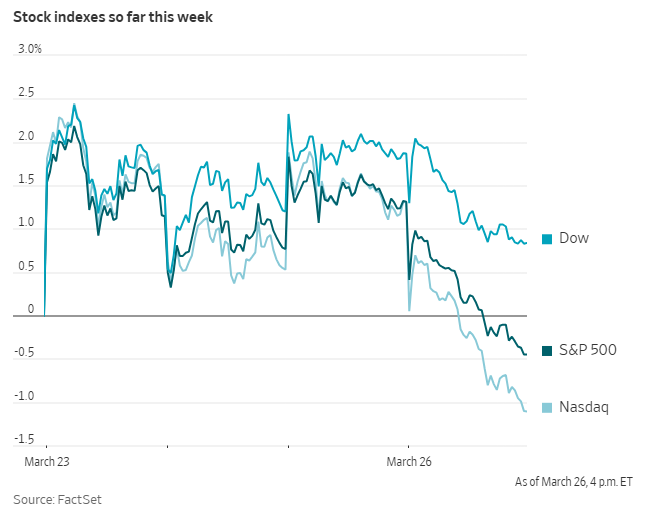
Investor sentiment is waning regarding the prospects for a swift resolution to the conflict in Iran. As hostilities persist, financial market distress is intensifying: The Dow Jones Industrial Average is on track for its steepest monthly percentage decline since 2022, while the Nasdaq Composite has entered correction territory, having fallen over 10% from its recent peak.
On Thursday, the Dow Jones dropped 469.38 points, or -1.01%. The S&P 500 declined by -1.74%, and the Nasdaq fell -2.38%. Both the S&P 500 and Nasdaq posted their largest single-day losses since the onset of the conflict, closing at their lowest levels since September.
In corporate news, shares of ON, the Swiss athletic footwear manufacturer, slid for a second consecutive day following the announcement of a leadership restructuring. The stock has declined more than 15% this week.
Henkel has reached an agreement to acquire Olaplex at a price of approximately $2.06 per share.
Hapag-Lloyd has issued a warning of a forthcoming earnings decline, citing disruptions to trade flows caused by the conflict in Iran.
Shares of H&M Hennes & Mauritz dropped in Stockholm after the company reported a lackluster start to the year in terms of sales.
S&P 500 Best performing sector
Energy +1.57%, with Valero Energy +5.80%, Occidental Petroleum +4.06% and APA +3.58%
S&P 500 Worst performing sector
Communication Services -3.46%, with Meta Platforms -7.96%, Paramount Skydance -3.79% and Alphabet -3.06%
Mega Caps
Alphabet -3.06%, Amazon -1.97%, Apple +0.11%, Meta Platforms -7.96%, Microsoft -1.37%, Nvidia -4.16% and Tesla -3.59%
Information Technology
Best performer: Gartner +4.24%
Worst performer: Lam Research -9.35%
Materials and Mining
Best performer: CF Industries +3.47%
Worst performer: Mosaic -4.54%
European Stock Indices
CAC 40 -0.98%
DAX -1.50%
FTSE 100 -1.33%
Commodities
Gold spot -3.86% to $4,376.60 an ounce
Silver spot -5.56% to $68.60 an ounce
West Texas Intermediate +4.61% to $94.48 a barrel
Brent crude +4.65% to $101.82 a barrel
Gold prices declined on Thursday, pressured by the strengthening US dollar.
Spot gold dropped -3.86% to $4,376.60 per ounce.
The uptick in the US dollar caused dollar-denominated bullion to become more expensive for holders of other currencies.
Since the outbreak of the US-Israeli conflict with Iran on 28 February, gold prices have decreased by -17.37%.
Spot silver declined -5.56% to $68.60 per ounce.
Crude oil futures closed higher on Thursday, rebounding from the previous session's losses as optimism for a rapid resolution to the Middle East conflict diminished.
Brent crude futures advanced by $4.52, or +4.65%, settling at $101.82 per barrel. US WTI crude futures gained $4.16, or +4.61%, to close at $94.48 per barrel. Trading volume for the front-month Brent contract was at its lowest since 27 February, the day preceding the commencement of US and Israeli strikes on Iran.
US Special Envoy Steve Witkoff confirmed that the US had sent a ‘15-point action list’ to Iran as a framework for negotiations aimed at ending the conflict. Iranian Foreign Minister Abbas Araqchi stated that Iran was reviewing the US proposal, but emphasised that there were no discussions underway regarding a ceasefire.
A senior Iranian official described the proposal as ‘one-sided and unfair,’ while the US President noted that Iran had offered to allow ten oil tankers to transit the Strait of Hormuz as a goodwill gesture during ongoing negotiations.
The Pentagon is reportedly preparing to deploy 10,000 additional ground troops to the Middle East to provide President Trump with expanded military options amid ongoing peace discussions with Tehran, according to Department of Defense sources cited by The Wall Street Journal. On the Iranian side, the Houthi movement in Yemen, which is aligned with Iran, announced its readiness to target the strategic Red Sea waterway in solidarity with Iran, a Houthi leader told Reuters.
Persistent military escalation, including additional troop deployments and renewed strikes, coupled with restricted tanker movements under stringent Iranian conditions, continue to exert pressure on global energy markets.
The US proposal, delivered via Pakistan, reportedly calls for Iran to eliminate its stockpile of highly enriched uranium, halt enrichment activities, curb its ballistic missile programme and reduce funding to regional allies, according to three Israeli cabinet sources familiar with the plan. A senior Iranian official criticised the proposal as failing to meet the minimum requirements for a viable agreement and serving primarily US and Israeli interests, yet emphasised that diplomatic efforts continue despite the current lack of a realistic peace framework.
Iraq’s oil production has declined, with storage facilities reaching critical capacity, according to three Iraqi energy officials. In 2025, Iraq was the second-largest crude producer within OPEC, following Saudi Arabia, based on data from the US Energy Information Administration.
In Russia, the Kirishinefteorgsintez refinery, one of the country’s largest, halted operations on Thursday after Ukrainian drone attacks resulted in fires at parts of the facility.
Nevertheless, there are indications that some crude shipments are resuming; a Thai oil tanker transited the Strait of Hormuz following diplomatic coordination with Iran, and Malaysia reported that its vessels were also being permitted passage.
Note: As of 4 pm EDT 26 March 2026
Currencies
EUR -0.22% to $1.1534
GBP -0.23% to $1.3331
Bitcoin -3.02% to $68,867.00
Ethereum -4.76% to $2,060.38
On Thursday, the US dollar remained resilient against major global currencies, as diminishing prospects for de-escalation in the Middle East heightened concerns over an extended energy shock and increased demand for safe-haven assets.
The US dollar index advanced +0.29% to 99.92.
The euro declined by -0.22%, settling at $1.1534, while the British pound fell by -0.23% to $1.3331.
The dollar also appreciated by +0.15% against the Japanese yen, reaching ¥159.64.
Fixed Income
US 10-year Bond +8.9 basis points to 4.424%
German 10-year +11.4 basis points to 3.076%
UK 10-year gilt +14.0 basis points to 4.916%
US Treasury yields continued to climb on Thursday, as persistent tensions in the Middle East heightened investor concerns regarding elevated oil prices and sustained inflationary pressures.
On Thursday, the yield on the US 10-year Treasury note increased +8.9 bps to 4.424%. The yield on the two-year note rose +10.0 bps to 4.000%. At the long end of the curve, the 30-year yield advanced +3.0 bps to 4.939%.
The US Treasury yield curve, as measured by the spread between the two- and 10-year notes, stood at 42.4 bps. Since the onset of the conflict on February 28th, the curve has experienced a bear-flattening of 14.1 bps.
On Thursday, the Treasury Department auctioned $44 billion in seven-year notes, which attracted subdued demand. The auction's bid-to-cover ratio stood at 2.43x, marginally below the 2.50x average for comparable offerings. Following the auction, seven-year yields rose +10.7 bps on the day to 4.253%. The auction cleared at 4.255%, almost 1.0 bps above the anticipated rate prior to the bidding deadline, indicating that investors required a premium to purchase the notes.
Primary dealers absorbed 12.4% of the new issue, marking the highest share since last November, and compared to the average of 11.5%. These figures suggest muted investor appetite for the latest seven-year note, prompting primary dealers to step in and take on the excess supply.
This auction followed earlier sales of two- and five-year notes earlier in the week, both of which also saw subdued demand.
According to CME Group's FedWatch Tool, Fed funds futures traders are pricing in 13.6 bps of rate hikes cuts in 2026, in contrast with the 2.4 bps of rate cuts priced in the previous week. Fed funds futures traders are now pricing in a 6.2% probability of a 25 bps rate hike at the 29th April FOMC meeting, matching last week’s 6.2% probability.
Eurozone bond yields increased on Thursday, driven by another surge in energy prices, as market participants grew increasingly skeptical about conflicting statements regarding the progress of ceasefire discussions between the US and Iran.
In addition, money markets adjusted expectations to anticipate further monetary tightening by the ECB after German Bundesbank President Joachim Nagel indicated that an interest rate increase in April remained an option. Nagel noted that by the ECB’s meeting on 29th – 30th April, policymakers would possess sufficient information concerning the economic implications of the ongoing conflict.
ECB President Christine Lagarde also signalled on Wednesday that the central bank could consider raising interest rates if the war continues to exert upward pressure on inflation over an extended period. By Thursday, money markets were pricing in over 75 bps of ECB rate hikes by the end of the year, compared to approximately 71 bps late on Wednesday.
Traders estimated the probability of an interest rate increase by April at around 65%, a level unchanged from the previous day.
Reflecting these expectations, Germany’s two-year bond yield, sensitive to changes in ECB policy, climbed +11.1 bps to 2.722%. Germany’s 10-year bond yield increased +11.4 bps to 3.076%, while the yield on its 30-year bond rose +8.5 bps to 3.514%.
Italian government bond yields saw steeper increases relative to peers, with the 10-year yield climbing +18.2 bps to 4.011%. Consequently, the spread between Italian and German 10-year bonds widened to 93.5 bps.
Note: As of 4 pm EDT 26 March 2026
While every effort has been made to verify the accuracy of this information, EXT Ltd. (hereafter known as “EXANTE”) cannot accept any responsibility or liability for reliance by any person on this publication or any of the information, opinions, or conclusions contained in this publication. The findings and views expressed in this publication do not necessarily reflect the views of EXANTE. Any action taken upon the information contained in this publication is strictly at your own risk. EXANTE will not be liable for any loss or damage in connection with this publication.
Ten artykuł jest publikowany wyłącznie w celach informacyjnych i nie powinien być traktowany jako oferta lub zachęta do kupna lub sprzedaży jakichkolwiek inwestycji lub powiązanych usług, do których można się tu odwołać. Obrót instrumentami finansowymi wiąże się ze znacznym ryzykiem strat i może nie być odpowiedni dla wszystkich inwestorów. Wyniki osiągnięte w przeszłości nie są wiarygodnym wskaźnikiem wyników w przyszłości.


Zarejestruj się i otrzymuj informacje rynkowe
Zarejestruj się i otrzymuj
informacje
rynkowe
Subskrybuj teraz


Stworzone przez profesjonalistów. Dla profesjonalistów.
