
Ooops… Nvidia did it again

Markets in February
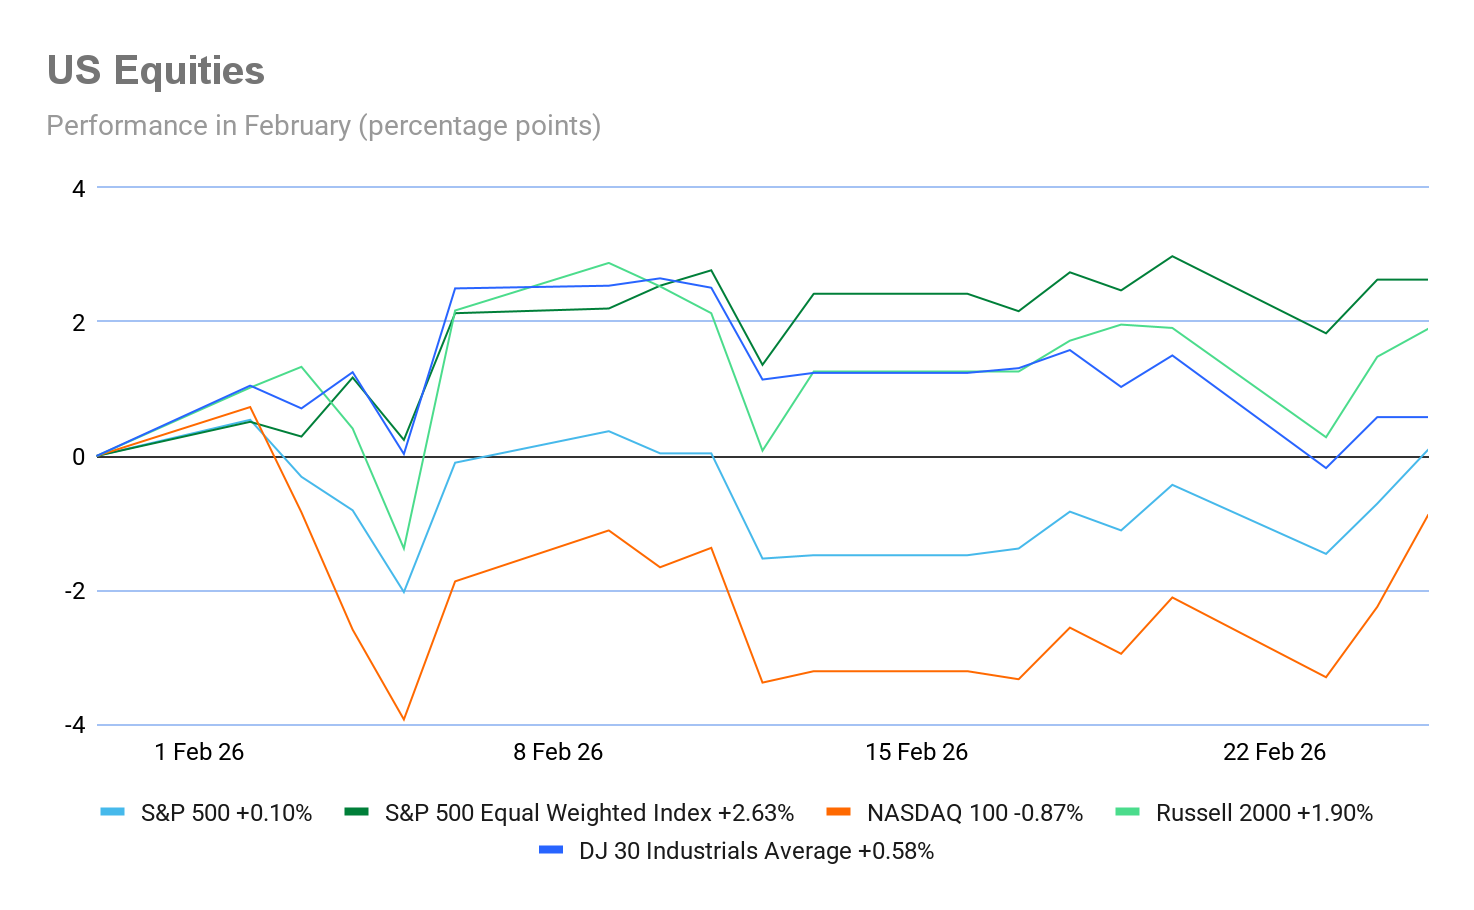
February has seen US equity markets reacting to fears of AI-driven disruption. Major US indices have shown a month-to-date (MTD) performance: S&P 500 +0.10%%, Nasdaq 100 -0.87%, Dow Jones +0.58%%, and Russell 2000 +1.90%.
US bond markets have remained in a narrow range this month, only appearing to make a move when data is showing clear signs of labour market weakness, which may push the Fed to cut rates, while higher yields are only being pushed by significantly firmer inflation signals and/or rising geopolitical risk. The 10-year Treasury yield has stayed around the 4% level again this month, with the yield curve, the spread between two- and 10-year yields, narrowing by 13.1 bps over the MTD. This flattening signals uncertainty about the US economy slowing down, whether disinflation will continue per Fed projections, and how quickly future interest rate cuts may occur.
The economic picture
USA: US economic data has been mixed this month. Nonfarm payrolls showed that employers added 130,000 jobs in January, far above the expected 65,000, and the unemployment rate declined to 4.3%. According to ADP, private sector employment increased by 22,000 jobs in January and pay was up 4.5% y/o/y. Its weekly private payrolls for the week ending 7 February showed an average of 12,750 jobs per week. It was the fourth straight week of strengthening job gains. Although the labour market appears to be holding up, a number of layoffs are in the pipeline across sectors as noted by Reuters, with companies such as Amazon stating that it was cutting 16,000 roles worldwide in its second major round of job cuts, Dow announcing cuts of 4,500, and Workday looking to cut 2% of its workforce. On the growth front, the data has shown a slowdown in US GDP in Q4 to only 1.4%. Business activity seems to be slowing down with the February Flash S&P Global Composite PMI falling to 52.3 from January’s 53.0 and a 10-month low. The S&P Global Services PMI was down, reaching 52.3, from January’s 52.7 and a 10-month low. The Flash Manufacturing PMI also fell, down from January’s 52.4 to 51.2, a 7-month low. On the consumer side, the February reading for US consumer confidence exceeded market expectations, coming in at 91.2, up from January’s 89.0. Despite this increase, the Present Situation Index declined by 1.8 points to 120.0, and the Expectations Index decreased by 4.8 points to 72.0, indicating some caution regarding future conditions. Labour market perceptions showed modest improvement. The share of consumers describing jobs as “plentiful” rose to 28.0% from January’s 25.8%. However, 20.6% of respondents indicated that jobs were “hard to get,” up from 19.0% previously, and 15.7% anticipated more job opportunities in the future, a slight increase from 14.8% in January. Inflation expectations over the next twelve months remained largely unchanged, though they continued to be elevated. The University of Michigan confidence survey indicated that US consumer sentiment stagnated this month, with the index just 0.2 points higher than January, coming at 56.4. All index components posted insignificant movements this month; overall, consumers do not perceive any material differences in the economy from last month. Year-ahead inflation expectations fell from 4.0% last month to 3.4% in February, the lowest reading since January 2025. However, February’s reading still exceeds those seen in 2024 and remains well above the 2.3-3.0% range seen in the two years pre-pandemic. Long-run inflation expectations held steady at 3.3%, just above the 2.8% and 3.2% range seen in 2024. Annualised inflation declined to 2.4% in January, down from December's 2.7%, according to the Bureau of Labor Statistics. It was 0.2% m/o/m, the smallest gain since July due to lower energy costs. Core annualised CPI was +2.5% y/o/y and 0.3% m/o/m. However, The Fed's favoured inflation measure, the December core PCE deflator, was hotter at +0.4% m/o/m and 2.9% y/o/y, than consensus estimates.
EU: The ECB kept the key deposit rate at 2% in February as eurozone headline inflation in January was 1.7% y/o/y, down from a revised 2% in December. Core inflation was 2.2% year-on-year, the lowest since October 2021. In the eurozone, Q4 negotiated wages rose 3% from a year ago, higher than the previous period’s 1.9% reading, but significantly below the 5.4% peak in 2024. According to the European Commission, there was a marginal uptick in euro area consumer confidence in February (0.2 points to minus 12.2), but this signals stabilisation rather than recovery. Sentiment remains firmly below its long-term norm, indicating households are still operating in a cautionary mode. In the fourth quarter of 2025, seasonally adjusted GDP increased by 0.3% in the euro area, compared with the previous quarter, according to a flash estimate published by Eurostat. In Q3 2025 GDP had increased by 0.3% in the euro area. The eurozone economy has now expanded for nine consecutive quarters. Compared with the same quarter of the previous year, seasonally adjusted GDP increased by 1.3% in the euro area, after a +1.4% rise in the euro area in the previous quarter. The HCOB Flash Eurozone Composite PMI rose to 51.9 from January’s 51.3, a 3-month high. The HCOB Flash Services PMI also rose to reach 51.8, edging slightly up from January’s 51.6 reading. The HCOB Flash Manufacturing PMI came in at 50.8, up from January’s 49.5, a 44-month high that means that manufacturing is finally in expansionary territory. Despite the faster increase in business activity, eurozone companies again showed a reluctance to take on additional staff in February. Employment decreased fractionally for the second consecutive month. Manufacturing staffing levels continued to fall, while services workforce numbers were unchanged, ending a five-year sequence of job creation. Price pressures remained largely contained around the central bank's target, but there are signs of inflation having picked up in recent months, notably in Germany.
UK: In the UK, the economy is showing some signs of growth amid labour market weakening. According to the Office for National Statistics, the unemployment rate climbed to 5.2% in Q4 2025, the highest since 2021. The number of employees on payroll fell 11,000 in January, taking the drop over the last year to 134,000. The S&P Global Flash Composite PMI rose to 53.9 in February, slightly up from January’s 53.7 and a 22-month high. The Flash Services PMI edged down to 53.9 from January’s 54.0. The Flash Manufacturing PMI rose to 52.0 from 51.8 in January, marking an 18-month high. Retail sales in the UK rose in January by 1.8% in January 2026, following a rise of 0.4% in December 2025 and a fall of 0.4% in November 2025. This was the largest monthly rise since May 2024. Sales volumes rose by 4.5% over the year to January 2026. Inflation in the UK remains above the BoE target. Headline CPI came in at 3.0% in the 12 months to January 2026, down from 3.4% in December, driven largely by drops in airfares, petrol and food prices. On a monthly basis, it was down 0.5% in January 2026, compared with a fall of 0.1% in January 2025. Core inflation rose by 3.1% in the 12 months to January 2026, down from 3.2% in the 12 months to December 2025; the CPI goods annual rate fell from 2.2% to 1.6%, while the CPI services annual rate fell from 4.5% to 4.4%. The BoE held rates at 3.75% earlier this month in a close 5-4 vote, with only Governor Andrew Bailey standing in the way of a further reduction. Nevertheless, traders are now betting on another cut this spring to take the rate down to 3.5%.
Global market indices
USA:
S&P 500 +0.10% MTD and +1.47% YTD
Nasdaq 100 -0.87% MTD and +0.31% YTD
Dow Jones Industrial Average +0.58% MTD and +2.31% YTD
NYSE Composite +3.23% MTD and +6.58% YTD
Source: FactSet
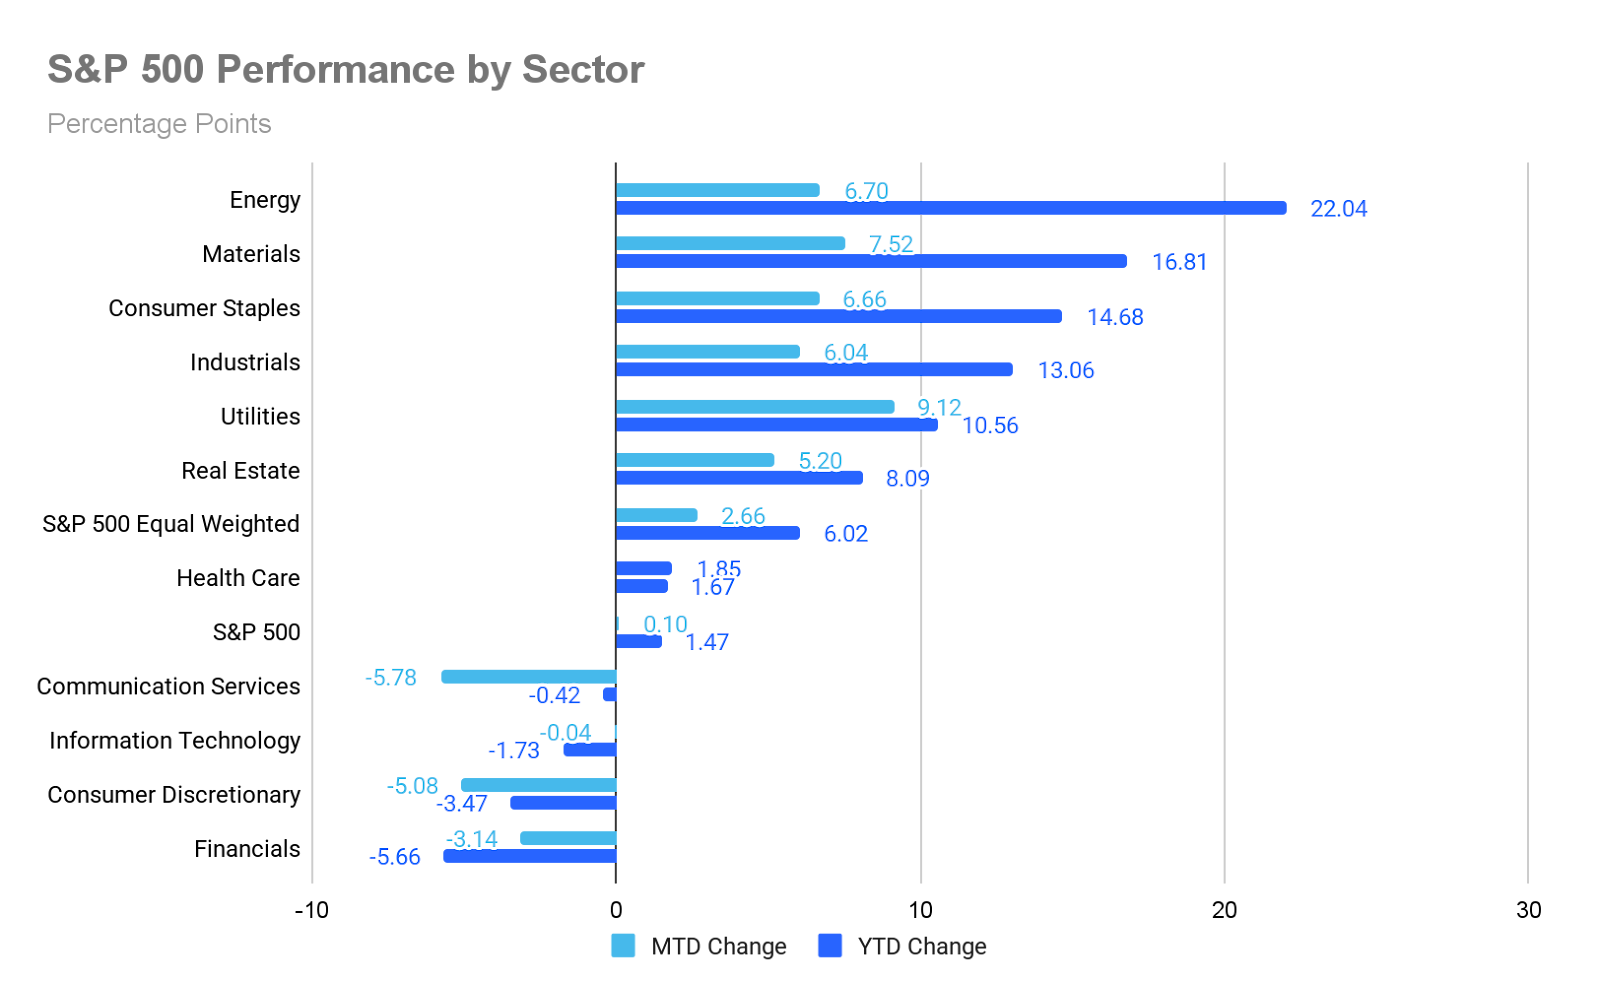
The Equally Weighted version of the S&P 500 is +2.66% MTD for February, 2.56 percentage points higher than the benchmark.
The S&P 500 Utilities sector is the top performer thus far in February at +9.12% MTD and +10.56% YTD, while Communication Services underperformed -5.78% MTD and -0.42% YTD.
US equities advanced on Wednesday, with technology stocks driving a second consecutive session of gains as market participants positioned themselves ahead of Nvidia’s highly anticipated earnings report.
The Information Technology sector led the S&P 500, rising +1.79% to top all sectors in what proved to be a mixed trading day. The Nasdaq Composite advanced +1.26%, while the Dow Jones Industrial Average increased by 308 points, or +0.63%. The S&P 500 advanced +0.58%.
In corporate news, AMD announced a $150 million investment in Nutanix stock as part of a newly established partnership that will include joint engineering and sales initiatives.
Shares of Circle Internet Group surged after the company reported that robust demand for its stablecoin contributed to increased profit and revenue during the Q4 downturn in digital assets.
Additionally, David Tepper, the founder of Appaloosa Management, publicly criticised Whirlpool on Wednesday and called for comprehensive changes at the company.
Europe:
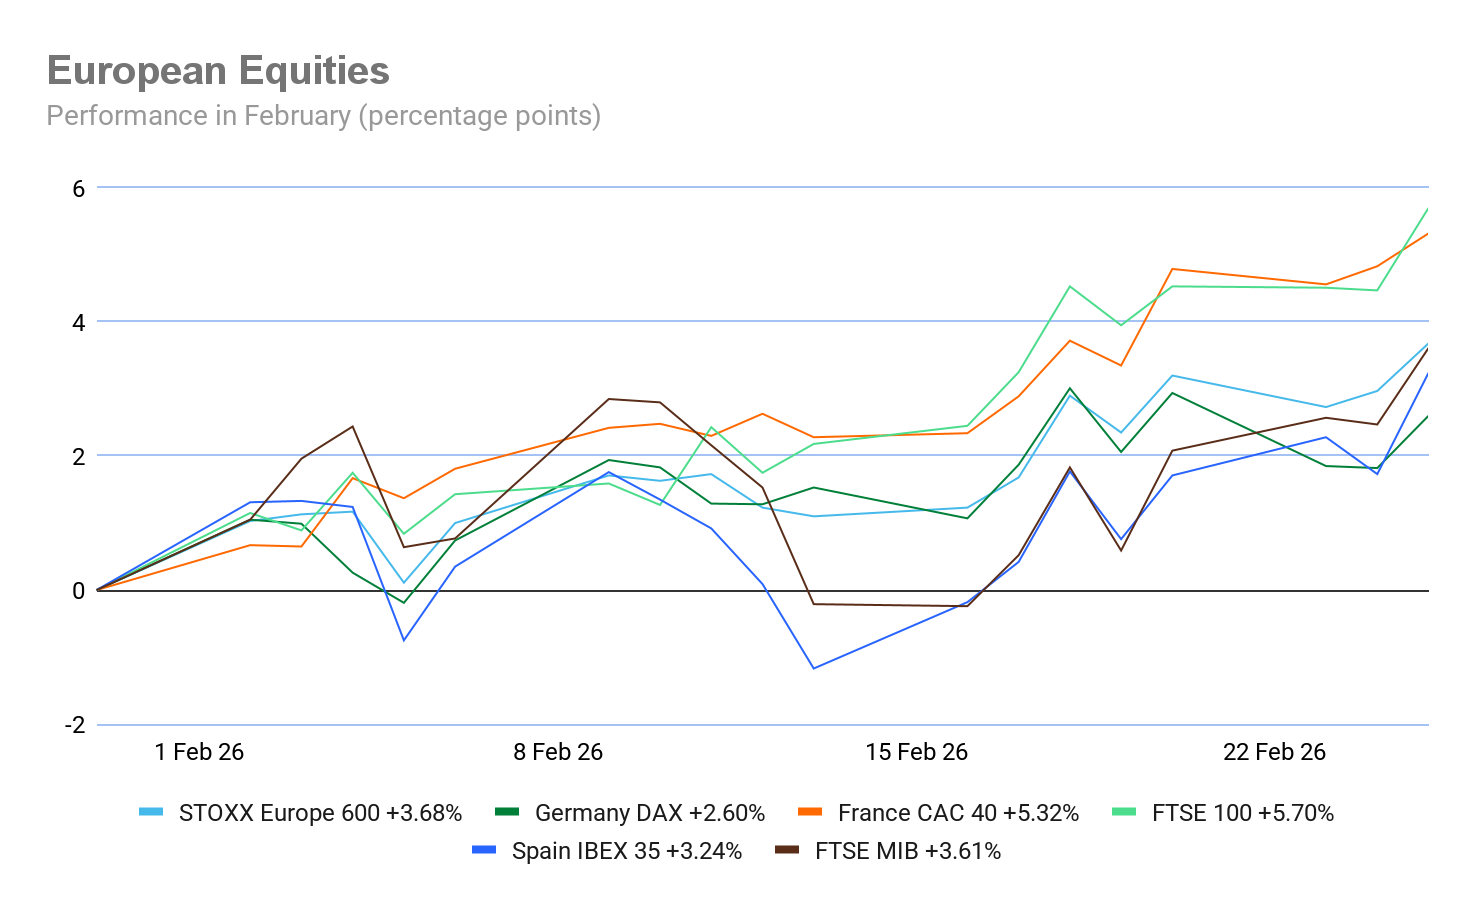
Stoxx 600 +3.68% MTD and +6.97% YTD
DAX +2.60% MTD and +2.80% YTD
CAC 40 +5.32% MTD and +5.03% YTD
FTSE 100 +5.70% MTD and +8.81% YTD
IBEX 35 +3.24% MTD and +6.66% YTD
FTSE MIB +3.61% MTD and +4.95% YTD
Source: FactSet
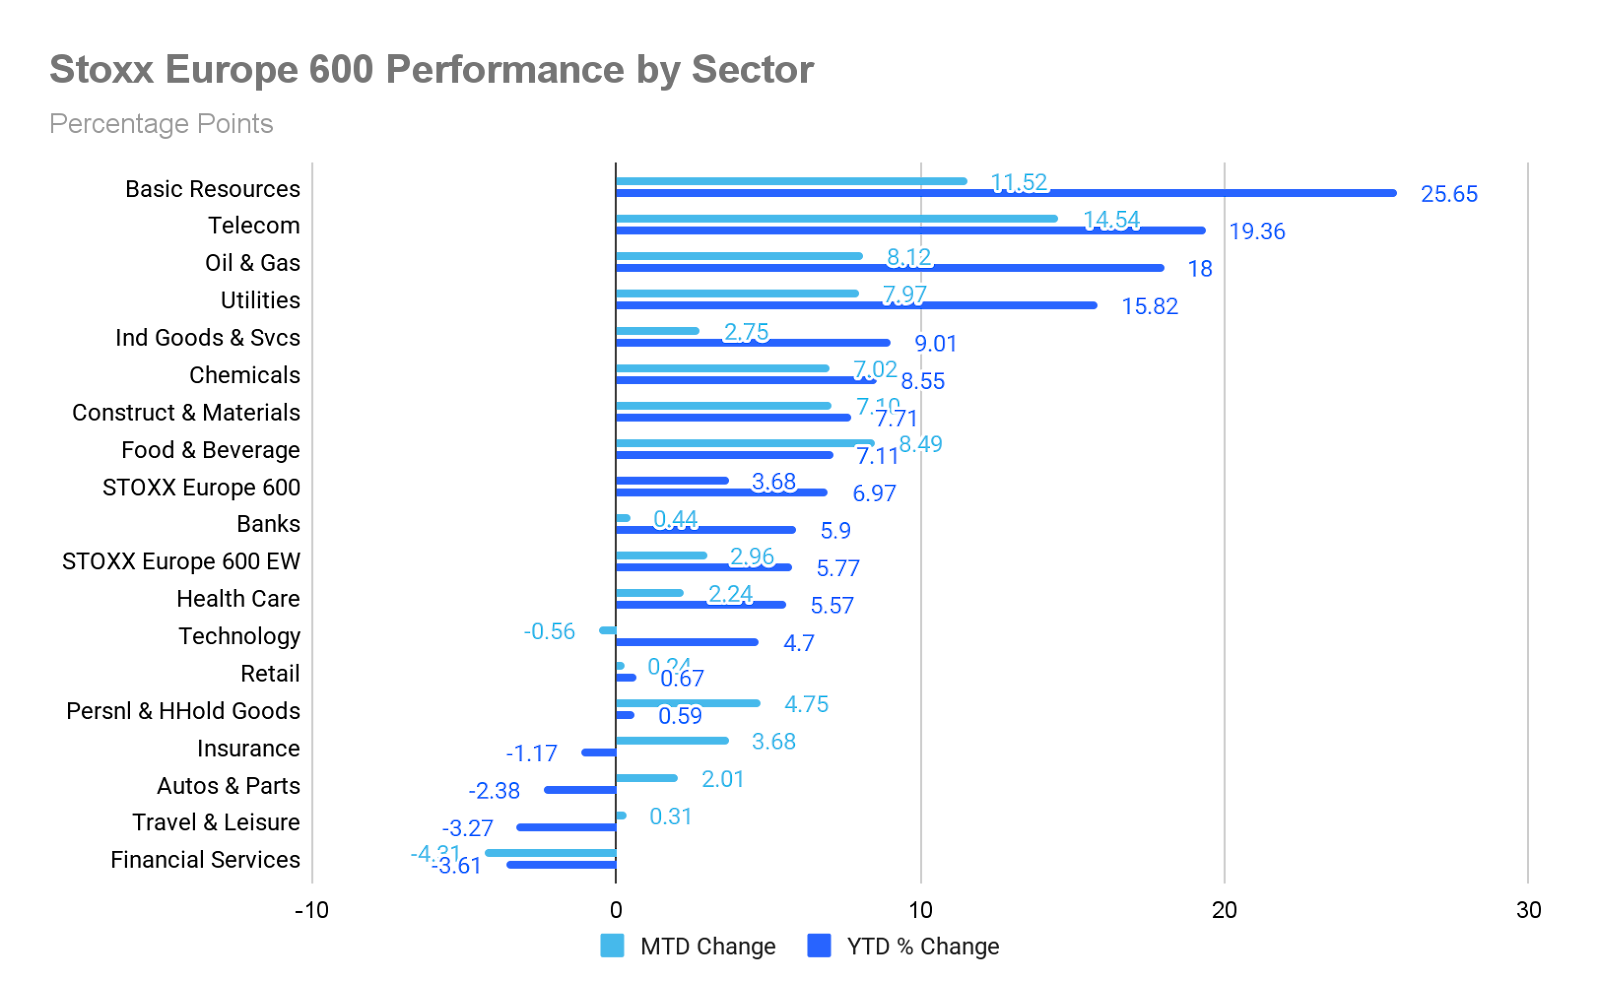
In Europe, the Equally Weighted version of the Stoxx 600 is +2.96% MTD, 0.72 percentage points lower than the benchmark.
The Stoxx 600 Telecommunications is the leading sector, +14.54% MTD, and +19.36% YTD, while Financial Services exhibited the weakest performance at -4.31% MTD and -3.61% YTD.
Banks outperformed on Wednesday, highlighted by HSBC’s shares rising after beating profit estimates and raising a key earnings target, underpinned by robust revenue growth and a resilient NIM. This shift reversed the previous day’s selloff linked to concerns over AI, particularly after Anthropic’s announcement of an updated plugin for the finance industry, which indicated a partnership approach to AI integration rather than displacement or margin compression. Basic Resources also outperformed as cyclical sentiment improved, supported by firmer commodity tone and broader beta.
Technology benefitted from easing fears of AI-driven disruption, further supported by a rally in Temenos shares following positive mid-term targets and favourable analyst commentary emphasising its business model resilience.
Oil & Gas advanced amid rising crude prices. Nordex shares rose after a ‘blowout’ Q4 results and raising its mid-term margin targets to 10-12%. Endesa advanced after receiving an upgrade from BNP Paribas and increasing its CapEx targets. Utilities gained as E.ON delivered strong full-year earnings and unveiled a €48 billion investment plan for 2026–2030. Additionally, attention centred on the announcement that UK energy bills are set to fall to their lowest levels in nearly two years.
Industrial Goods & Services traded higher, particularly in the staffing segment, as Adecco Group rose following solid Q4 results, reflecting resilient demand and margin improvement across services. In contrast, Food & Beverages was the primary underperformer, with Diageo declining sharply after cutting its sales and dividend guidance. Edenred also fell after a Brazilian court reinstated changes to the meal-voucher system.
Personal & Household Goods traded lower, with Beiersdorf retreating after being downgraded on valuation concerns, given its strong performance year-to-date. Construction & Materials lagged, with Heidelberg Materials posting a decline following guidance that its 2026 RCO would only marginally exceed 2025 and fell short of consensus expectations. Umicore shares also fell after an 8% stake was sold at a discount.
Global:
MSCI World Index +1.12% MTD and +3.33% YTD
Hang Seng -2.27% MTD and +4.43% YTD
Mega cap stocks have had a mixed performance MTD as concerns surrounding the sustainability of the AI CapEx hypercycle have been exacerbated by decelerating growth and margin compression. Thus far in February, Apple +5.68%, and Nvidia +2.32%, while Tesla -3.02%, Microsoft -6.90%, Alphabet -7.43%, Meta Platforms -8.77%, and Amazon -11.98%.
Nvidia’s Q4 print: record everything. Nvidia delivered another historic quarter on Wednesday, and for a moment, it looked like the AI trade was back on. Then the after-hours action told a more nuanced story. The AI darling is now defined by the dynamic tension between its excellent performance and the immense expectations surrounding it.
Nvidia Q4 FY2026 revenue hit $68.127 billion, up 73.2% y/o/y and 19.5% sequentially — the largest q/o/q dollar increase in company history. It topped the consensus of $66.127 billion. EPS came in at $1.62, beating the $1.54 estimate. The engine room was, unsurprisingly, Data Centre: $62.300 billion in revenue, up 75% y/o/y, exceeding the $60.691 billion estimate. Within that, compute revenue reached $51.334 billion, up 56.2% y/o/y, while networking reached $10.980 billion, an increase of 218.2% y/o/y driven by NVLink, Spectrum-X, and InfiniBand adoption. Net income for the quarter increased 79.2% y/o/y to $39.552 billion, bringing full year 2025 profit to $116.997 billion and exceeding expectations for $37.521 billion. Net margin reflected an expansion of 190 bps from 56.1% a year ago to 58.0% in Q4.
The guidance was the highlight. Nvidia projected Q1 revenue of $76.440 to $79.560 billion, above the $74.639 billion Wall Street was modeling — implying 77.0% y/o/y growth, the fastest clip since early 2025. Critically, that guidance excludes any Data Centre compute revenue from China, leaving meaningful optionality if export rules shift.
Despite the clean beat-and-raise, shares initially increased 3 to 4% in after-hours trading before paring nearly all gains and drifting back toward $195 per share. The Wall Street Journal noted that Nvidia's average post-earnings move over the last five years has been 6.5%, making Wednesday's restrained reaction a signal in itself. Bloomberg news framed the report as the biggest test for an AI-obsessed market that has no patience for hiccups. The muted response confirms a ‘sell the news’ dynamic: after a 54.4% run over the past twelve months, a clean top and bottom line beat and an upbeat guidance wasn't enough to reset the bar higher.
The bullish narrative centres on an accelerating product roadmap. CFO Colette Kress confirmed that first Vera Rubin samples shipped to customers this week, compressing the next-generation timeline by roughly a year. Nvidia is guiding for Rubin-based volume shipments in the second half of 2026, targeting a 10x improvement in cost per token versus Blackwell. CEO Jensen Huang reinforced the narrative on the call: ‘Inference equals revenues now for our customers,’ framing agentic AI as the next scaling vector.
The counterargument is more subtle but real. While Q4 gross margin held at 75.2%, full-year FY2026 non-GAAP gross margin came in at 71.3%, down from 75.5% a year earlier — reflecting the cost pressures of HBM4 memory, advanced CoWoS packaging, and the Blackwell production ramp. Operating expenses increased 50.2% y/o/y to $5.102 billion, as Nvidia invests aggressively across compute, networking, and its software ecosystem. The question is whether custom silicon competition (Google TPUs, Amazon Trainium, AMD accelerators) will prevent full margin recovery as Nvidia scales. Nvidia's gaming segment, once its core, grew 48.0% y/o/y to $3.700 billion but declined 14.0% sequentially, with analysts speculating memory shortages may force the company to forgo a new gaming GPU launch this year in favour of AI accelerators.
The conference call underscored central themes shaping the company's outlook. Confidence in cloud customers' CapEx remains strong, supported by rising demand for Agentic AI and token generation. Nvidia is investing strategically to broaden its AI ecosystem, anchored by the CUDA platform. Guidance indicates continued robust data centre revenue growth as Blackwell and Vera Rubin products scale in H2 2026. Geopolitical and regulatory uncertainty, especially US-China export controls and competition in China, were identified as key risks.
Energy stocks experienced a positive performance so far in February with the Energy sector +6.70% MTD. Baker Hughes Company +15.65%, Occidental Petroleum +12.23%, Marathon Petroleum +11.11%, Shell +7.77%, Phillips 66 +5.82%, ConocoPhillips +5.55%, ExxonMobil +5.42%, Apa Corp +5.41%, Halliburton +5.22%, Chevron +4.14%, and Energy Fuels +1.58%.
Materials and Mining stocks have had a mostly positive performance MTD in February. The Materials sector is +7.52% MTD. Albemarle +14.79%, Freeport-McMoRan +14.26%, Celanese Corporation +12.58%, Newmont Mining +11.13%, Yara International +6.16%, and CF Industries Holdings +3.12%, while Nucor Corporation -1.26%, Mosaic -1.89%, and Sibanye Stillwater -10.34%.
Commodities
Gold gained on Wednesday as investors moved into safe havens on concerns that tariffs could stoke inflation, while ongoing tensions between Iran and the US also kept bids for safety intact.
Spot gold rose +0.47% to $5,164.55 per ounce. Prices scaled a record high of $5,594.82 on 29th January and are up +19.71% so far this year. It has increased +6.17% through February.
Spot silver climbed +2.42% to $89.21 per ounce, a three-week high. On 29th January, silver scaled an all-time peak of $121.64. It is up +25.19% so far this year.
Oil prices declined slightly on Wednesday, weighed down by ongoing concerns regarding potential disruptions to supply amid the persistent threat of military conflict between the US and Iran.
Brent crude futures settled 20 cents, or -0.77%, lower at $71.04 per barrel, while US WTI futures closed down 51 cents, or -0.28%, at $65.57. Brent is +0.48% MTD and WTI -0.26% MTD.
Both benchmarks had recently touched highs, with Brent reaching its strongest level since 31st July on Friday and WTI hitting its highest point since 4th August on Monday. These gains coincided with the US deploying military assets to the Middle East, aiming to pressure Iran into negotiating an end to its nuclear and ballistic missile programmes.
An escalation in hostilities poses a significant risk to global oil supplies, particularly as Iran stands as the third largest crude producer within OPEC. The broader Middle East region also remains vulnerable to potential supply interruptions should tensions intensify.
US envoys Steve Witkoff and Jared Kushner are scheduled to meet with an Iranian delegation for a third round of discussions today in Geneva. Iranian Foreign Minister Abbas Araqchi remarked on Tuesday that an agreement with Washington was ‘within reach, but only if diplomacy is given priority’.
OPEC+ is expected to deliberate on increasing its oil output by 137,000 barrels per day for April, potentially concluding a three-month pause in production hikes. According to sources familiar with the group’s considerations, this move is being evaluated as OPEC+ prepares for peak summer demand and as market uncertainty persists due to US-Iran tensions.
Eight OPEC+ member countries, Saudi Arabia, Russia, the United Arab Emirates, Kazakhstan, Kuwait, Iraq, Algeria, and Oman, are set to convene on 1st March to discuss these matters further.
EIA report. According to the EIA’s report released Wednesday, US crude oil refinery inputs averaged 15.7 million barrels per day during the week ending 20 February, which was 416 thousand barrels per day less than the previous week’s average. Refineries operated at 88.6% of their operable capacity last week.
US crude oil imports averaged 6.7 million barrels per day last week, increasing by 136 thousand barrels per day from the previous week. Over the past four weeks, crude oil imports averaged about 6.5 million barrels per day, 4.9% more than the same four-week period last year.
US commercial crude oil inventories increased by 16.0 million barrels from the previous week. At 435.8 million barrels, US crude oil inventories are about 3% below the five year average for this time of year. Total motor gasoline inventories decreased by 1.0 million barrels from last week and are 3% above the five year average for this time of year.
Distillate fuel inventories increased by 0.3 million barrels last week and are about 5% below the five year average for this time of year.
Currencies
On Wednesday, the US dollar index retreated by -0.23% to 97.65, reflecting ongoing uncertainty regarding President Trump’s anticipated response to the Supreme Court’s ruling on 20th February, which invalidated his emergency tariffs.
The US dollar index is +0.52% so far in February and -0.63% YTD.
According to US Trade Representative Jamieson Greer, the tariff rate for certain countries will increase to 15% or higher from the recently imposed 10%. However, Greer did not specify which trading partners would be affected, nor did he provide additional details.
In his 2026 State of the Union address, President Trump focused on the economy, but offered minimal insight into forthcoming policy initiatives.
The euro appreciated +0.32% to $1.1809, while the British pound also advanced, ending the session at $1.3556, up +0.51%. Against the US dollar, the euro is -0.49% MTD and +0.54% YTD.
Sterling gained +0.10% against the euro, reaching 87.17 pence. Last week, it touched its lowest level since 19th December at 87.52 pence. The GBP is -0.96% against the dollar MTD and +0.62% YTD.
BoE Governor Andrew Bailey stated on Tuesday that a rate cut in March was possible, although he noted that services price inflation had not eased as much as hoped in recent data. The BoE adopted a more dovish stance in early February, maintaining policy in a notably close 5 – 4 vote. The Bank indicated that interest rates would likely decrease if a decline in inflation continues.
The yen depreciated -0.30% against the dollar, settling at ¥156.35, its weakest position in two weeks. The yen is -1.03% MTD and +0.19% YTD.
BoJ Governor Kazuo Ueda announced that the central bank will scrutinise economic data at its March and April meetings before deciding whether to raise interest rates, as reported by the Yomiuri newspaper. This statement left open the possibility of a near-term rate hike and contributed to the yen’s recovery from earlier losses on Wednesday. The Japanese government appointed two academics known for their advocacy of economic stimulus to the central bank’s board on Tuesday.
Cryptocurrencies
Bitcoin -18.15% MTD and -21.39% YTD to $63,938.96
Ethereum -22.33% MTD and -29.47% YTD to $2,100.75
Bitcoin was +7.62% and Ethereum was +13.28% on Wednesday. Cryptocurrencies have continued to fall this month with institutional investors showing continued wariness following the $19 billion redemption in October, with global geopolitical and macro uncertainties also influencing behaviour. The ongoing risk aversion may be attributed to concerns around the ongoing US - Iran negotiations, President Donald Trump's global tariff changes following the US Supreme ruling his prior tariffs illegal, and technical level factors. As noted by CoinDesk, investors have withdrawn nearly $3.8 billion from US-listed Spot Bitcoin exchange-traded funds over the past five weeks, marking the longest outflow streak since February 2025. According to Bloomberg news, this means that nearly 45% of all cryptocurrency coins are worth less than what their holders paid. Options traders are paying for crash protection. BlackRock's IBIT, the largest Spot Bitcoin ETF, has led the retreat with about $2.13 billion in redemptions over the same period.
Note: As of 5:00 pm EST 25 February 2026
Fixed Income
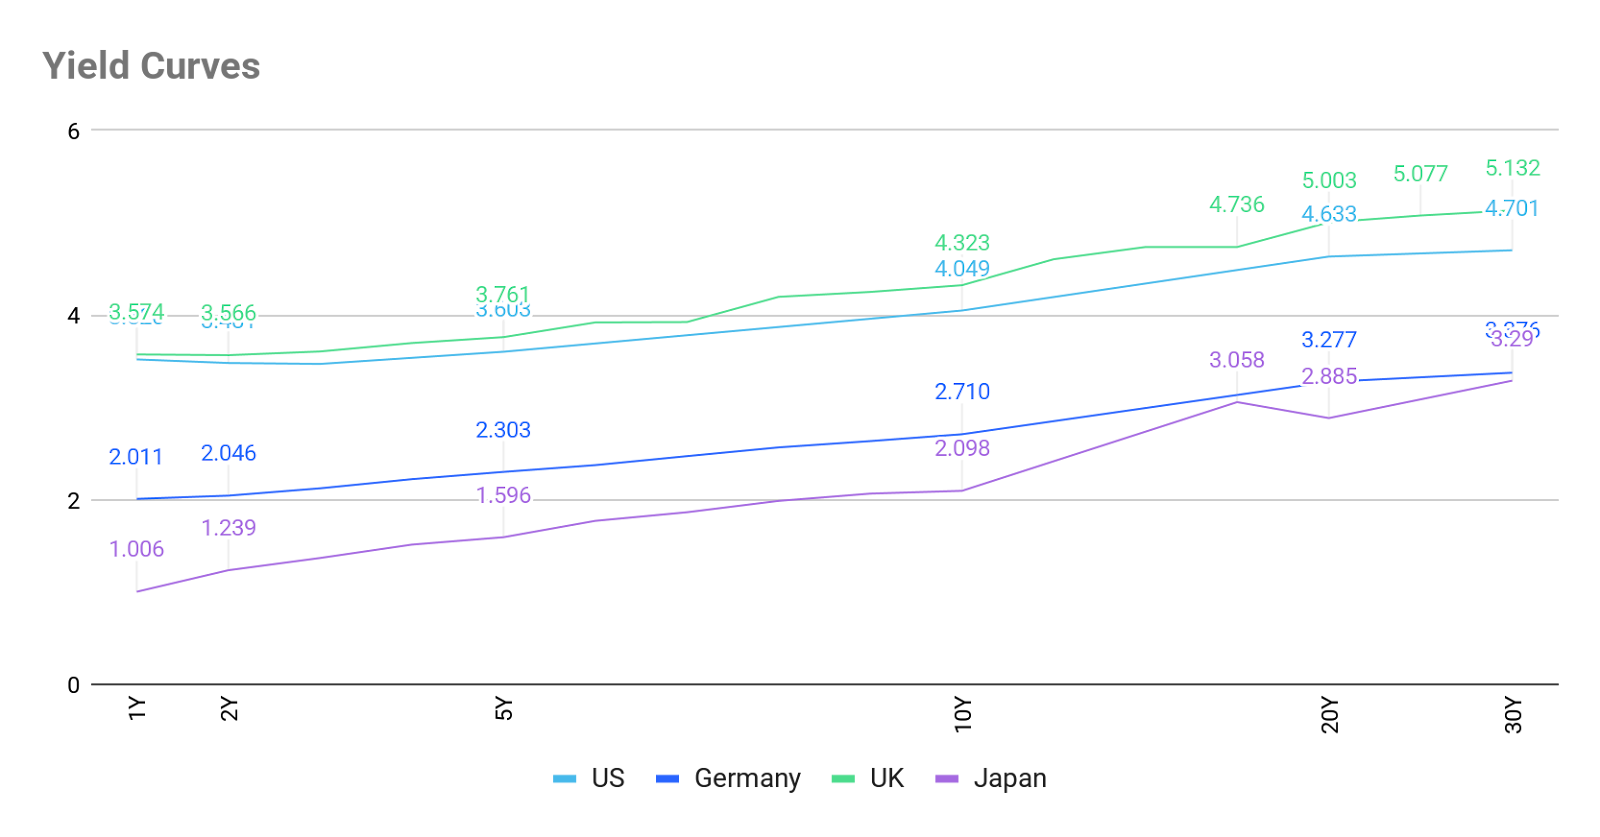
US 10-year yield -18.9 bps MTD -12.3 bps YTD to 4.049%
German 10-year yield -13.7 bps MTD -15.0 bps YTD to 2.710%
UK 10-year yield -20.7 bps MTD -15.5 bps YTD to 4.323%
US Treasury securities declined for the second consecutive session on Wednesday, prompted by subdued demand for US five-year notes during an auction.
The Treasury auctioned $70 billion in five-year notes, which cleared at a yield of 3.615%, slightly above the expected rate at the bidding deadline, indicating that investors required a marginally higher return to purchase the notes. The bid-to-cover ratio stood at 2.32x, below the six-auction average of 2.36x. Dealers absorbed 12.8% of the supply, the highest proportion since March 2025 and significantly above the recent average of 10.1%. This elevated take-up by primary dealers suggests that end-user demand was weaker than usual, and dealers were compelled to backstop the auction.
Following the auction, the yield on the US five-year note rose +2.3 bps to 3.619%. In addition to the five-year note, the Treasury also sold $69 billion in 17-week bills and $28 billion in two-year floating-rate notes on Wednesday.
This week has also seen substantial corporate bond issuance, with approximately $49 billion in new investment-grade debt launched in the first two days alone. Further deals are anticipated, with forecasts projecting total bond supply at $52 billion to $57 billion for the week. Such a volume of corporate issuance could exert downward pressure on Treasury prices as well.
In afternoon trading, the yield on the 10-year Treasury note increased +1.4 bps to 4.049%, while 30-year yields rose +1.5 bps to 4.701%. At the short end of the curve, the two-year yield, closely linked to interest rate expectations, edged up by +0.9 bps to 3.481%.
The yield curve steepened slightly on Wednesday, with the spread between the two- and 10-year yields widening to 56.8 bps from 56.3 bps at the end of Tuesday’s session. Prior to this, the curve had flattened for ten consecutive sessions, the longest such period since November 2015, wherein short-term yields rose relative to longer-dated Treasuries. Over the course of February, the curve has flattened, with the spread between two- and 10-year yields narrowing by 13.1 bps, from 69.9 bps at the end of January to 56.8 bps on Wednesday.
The yield on the US 10-year Treasury note is -18.9 bps MTD for February. The US 30-year yield is -17.4 bps. At the short end, the two-year Treasury yield is -5.8 bps MTD.
Current sentiment in the Fed funds futures market, according to CME's FedWatch Tool, suggests a 96.4% probability of rates remaining at the 3.50 - 3.75% range at the March FOMC meeting, higher than the 84.6% implied probability one month ago.
Source: FactSet
In the UK the 10-year gilt was +1.9 bps higher to 4.323% on Wednesday. On the short end, the 2-year gilt was +1.4 bps to 3.576%. The UK's 30-year gilt yield +2.8 bps to 5.135%. In the UK, the 10 year gilt yield is -20.7 bps lower MTD. The UK 30 year is -15.4 bps so far in February.
Across the channel, on Wednesday, Germany's 10-year government bond yield edged slightly higher, though it remained close to its lowest level since November.
The 10-year Bund yield rose +0.1 bps to 2.710%. This followed a decline to 2.697% on Tuesday, marking its lowest point since 28th November.
The implications of the recently introduced US import tariffs on monetary policy remain uncertain. However, ECB President Christine Lagarde commented on Monday that both inflation and policy are in a ‘good place’, suggesting that no immediate policy adjustments are under consideration.
Data released on Wednesday confirmed that consumer price growth across the euro zone stood at 1.7% y/o/y for January, representing the lowest rate since September 2024. This moderation in inflation was primarily driven by a decline in energy prices.
Germany's two-year Schatz yield, sensitive to shifts in interest rate expectations, increased +0.5 bps to 2.046%. On the long end, the 30-year Bund yield was -0.3 bps at 4.701%.
Futures markets are currently pricing in approximately a 25% probability of an ECB interest rate cut by year-end.
Italy's 10-year government bond yield declined -1.2 bps to 3.308%, resulting in a slight narrowing of the spread between German and Italian 10-year yields by 1.3 bps to 54.9 bps.
The German 10-year yield is -13.7 bps MTD for February. The spread between US 10-year Treasuries and German Bunds stands at 133.9 bps, reflecting a contraction of 5.2 bps over the month so far, from 139.1 bps at the end of January.
The 2-year Schatz is -3.4 bps MTD and the German 30-year yield is -12.1 bps MTD.
France’s 10-year OAT yield is -17.2 bps to 3.259% MTD. The spread of French government bonds versus German Bunds has narrowed by 3.5 bps over the month to 54.9 bps, from 58.4 bps at the end of January.
Italy's 10-year government bond yield was -1.2 bps to 3.308% on Wednesday, leaving the spread over its German equivalent at 59.8 bps. During February this spread has contracted by 1.3 bps. The Italian 10-year BTP yield has declined by -15.7 bps MTD.
Note: As of 5:00 pm EST 25 February 2025
What to think about in March 2026
Should investors really start to think about stagflation-lite? The US economy is sending mixed signals, with GDP expected to slow, with growth below 2% and inflation remaining sticky, creating a "higher for longer" environment, which may be driven by tariff costs being passed onto the end consumer, high housing costs, and slower wage growth. The labour market, while still relatively tight due to immigration policies, is showing weakness with the US economy adding just 181,000 jobs in 2025, versus the previously estimated 584,000. Despite the unexpectedly high growth in jobs in January there has also been talk of elevated layoff plans and a fall in job openings.
The collision of persistent inflation, decelerating growth signals, and a radically uncertain trade policy is pushing the US macro environment toward a stagflationary corridor, a condition that limits Fed policy options and complicates asset allocation across the board.
The latest data paint a conflicted portrait. January headline CPI cooled to 2.4% y/o/y, down from 2.7% in December and the lowest reading since May 2025. Core CPI eased to 2.5%, with shelter inflation moderating to a 3.0% annual pace. On the surface, this appears encouraging. However, the Fed's preferred gauge tells a different story: December core PCE (released 20th February) accelerated to 3.0% y/o/y, up from 2.8% in November, with headline PCE at 2.9%. Monthly core PCE jumped 0.4%, double the November pace and above the 0.3% consensus. With core PCE at 3.0% and trending higher, the Fed is constrained at its current rate, as lowering rates could elevate the risk of renewed inflationary pressures.
Layer onto this backdrop the post-SCOTUS tariff chaos. The Supreme Court's 6 - 3 ruling on 20th February struck down the administration's IEEPA-based tariffs as unconstitutional, invalidating the legal cornerstone of reciprocal trade policy. Within hours, the White House pivoted to Section 122 of the Trade Act of 1974, imposing a 10% global import surcharge effective 24th February, with the administration signalling a higher rate ‘will come later,’ potentially up to the statutory 15% ceiling. The legal basis is already under scrutiny. Section 122 was designed for fixed-exchange-rate-era balance-of-payments crises, and multiple legal scholars question whether it applies in a floating-rate world. The 150-day statutory clock, expiring 24th July absent a congressional vote to extend, creates a ‘ticking clock’ that leaves multinational corporations in strategic limbo, reinforcing a deceleration in CapEx and job creation.
Geopolitically, the retaliation playbook is already in motion. The EU suspended ratification of the Turnberry trade agreement and warned of reactivating up to €93 billion in retaliatory levies on US exports including bourbon and steel. China's Ministry of Commerce labelled the measures ‘unilateral and illegal,’ threatening to adjust countermeasures, including potential restrictions on rare-earth exports, ‘in due course’.
This is a challenging environment for traditional portfolios. A stagflationary-light mix tends to produce positive stock-bond correlation, undermining the diversification benefit of US government bonds in portfolios.
The operative risk is that tariff-induced cost pressures, arriving atop an already-sticky inflation base, prevent the Fed from easing even as growth softens. That is the textbook definition of a stagflationary trap, and until there’s more certainty on either the inflation trajectory or the trade regime, it warrants an active and defensive asset allocation.
Key events in March 2026
The potential policy and geopolitical risks for investors that could affect corporate earnings, stock market performance, currency valuations, sovereign and corporate bond markets and cryptocurrencies include:
8 March General Election, Colombia. The electoral race is extremely polarised, with a potential for a run-off between the left and the right, rather than a moderate centrist outcome.
17-18 March Federal Reserve Monetary Policy Meeting. The Fed is widely expected to keep rates on hold at this meeting as the labour market is still, for now, reporting better than expected strength. However, there are signs that the labour market is weakening given the large number of lay-off announcements since the start of the year.
18-19 March European Central Bank Monetary Policy Meeting. With headline inflation in the eurozone below the 2% target, the ECB is not expected to cut rates again at this meeting. Instead, policymakers will be looking at euro strength and the impact this may have on growth.
18-19 March Bank of Japan Monetary Policy Meeting. Japan’s Prime Minister Sanae Takaichi has nominated two dovish academics, Ayano Sato, of Aoyama Gakuin University, and Toichiro Asada, of Chuo University, to the BoJ’s nine-member policy board. This may result in stronger criteria to normalise interest rates with an increased likelihood of a more divided board. However, if growth and inflation figures are consistent with the BoJ’s projections, rate normalisation is expected to proceed, but not at this meeting.
19 March Bank of England Monetary Policy Meeting and Minutes. The BoE will be under pressure to cut rates given the rise in unemployment to its highest level since 2021. BoE governor Andrew Bailey has said he may support another interest rate cut at the March meeting if there is additional evidence that inflation was easing towards the bank’s target.
26-29 March World Trade Organization Ministerial Conference. The biannual WTO ministerial conference will take place in Yaoundé, Cameroon during which trade ministers from around the world will review the multilateral trading system.
While every effort has been made to verify the accuracy of this information, EXT Ltd. (hereafter known as “EXANTE”) cannot accept any responsibility or liability for reliance by any person on this publication or any of the information, opinions, or conclusions contained in this publication. The findings and views expressed in this publication do not necessarily reflect the views of EXANTE. Any action taken upon the information contained in this publication is strictly at your own risk. EXANTE will not be liable for any loss or damage in connection with this publication.
Ten artykuł jest publikowany wyłącznie w celach informacyjnych i nie powinien być traktowany jako oferta lub zachęta do kupna lub sprzedaży jakichkolwiek inwestycji lub powiązanych usług, do których można się tu odwołać. Obrót instrumentami finansowymi wiąże się ze znacznym ryzykiem strat i może nie być odpowiedni dla wszystkich inwestorów. Wyniki osiągnięte w przeszłości nie są wiarygodnym wskaźnikiem wyników w przyszłości.


Zarejestruj się i otrzymuj informacje rynkowe
Zarejestruj się i otrzymuj
informacje
rynkowe
Subskrybuj teraz


Stworzone przez profesjonalistów. Dla profesjonalistów.
