
Back to business

Corporate Earnings Calendar
13th November - 19th November 2025
Thursday: Applied Materials, JD.Com, The Walt Disney Company, Williams-Sonoma
Monday: Xpeng
Tuesday: Baidu, Medtronic, Home Depot
Wednesday: Deere & Company, Nvidia, Palo Alto Networks, Target
Global market indices
US Stock Indices Price Performance
Nasdaq 100 -1.32% MTD and +21.44% YTD
Dow Jones Industrial Average +1.45% MTD and +13.42% YTD
NYSE +1.62% MTD and +14.19% YTD
S&P 500 +0.16% MTD and +16.48% YTD
The S&P 500 is +0.80% over the past seven days, with 8 of the 11 sectors up MTD. The Equally Weighted version of the S&P 500 is +1.49% over this past week and +8.45% YTD.
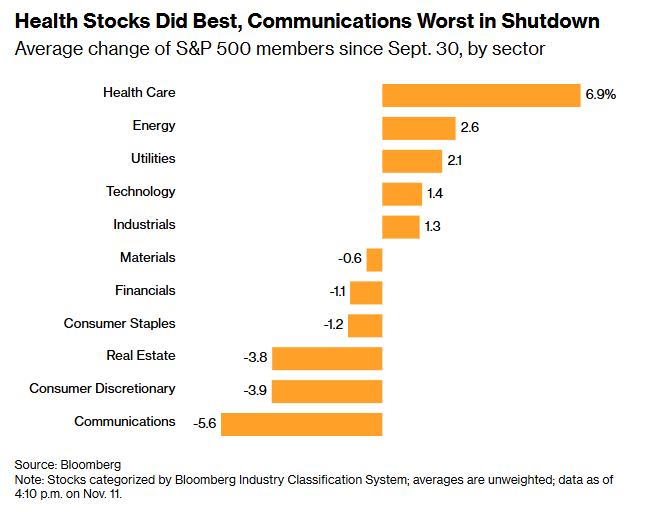
The S&P 500 Health Care sector is the leading sector so far this month, +5.89% MTD and +10.86% YTD, while Information Technology is the weakest sector at -2.14% MTD and +26.54% YTD.
Over this past week, Health Care outperformed within the S&P 500 at +4.87%, followed by Materials and Energy at +3.80% and +3.22%, respectively. Conversely, Consumer Discretionary underperformed at -1.87%, followed by Information Technology and Communication Services at -0.18% and +0.25%, respectively.
The equal-weight version of the S&P 500 was +0.23% on Wednesday, outperforming its cap-weighted counterpart by 0.17 percentage points.
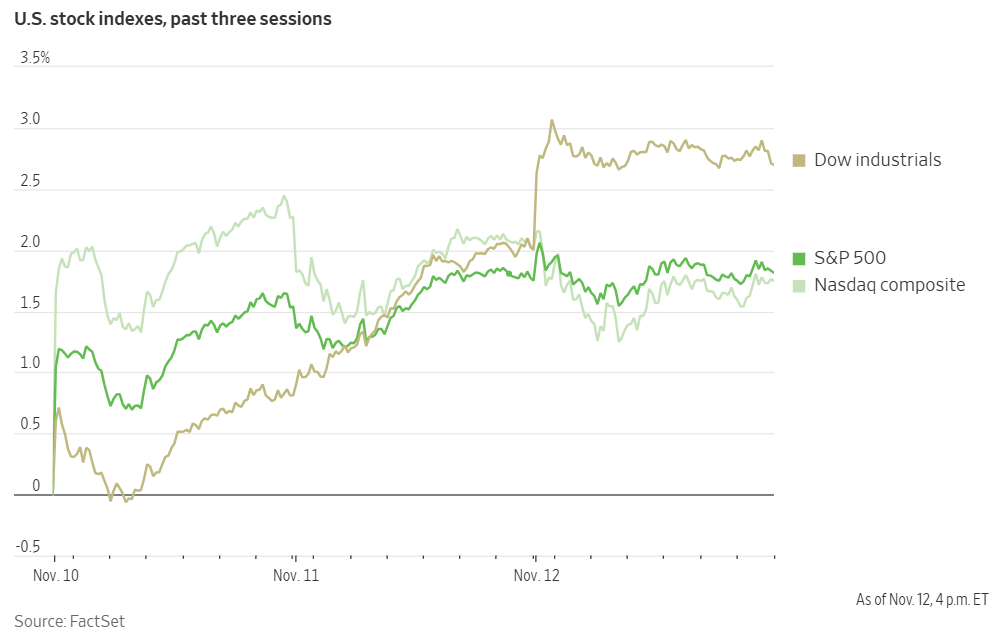
Investor confidence about the anticipated resolution of the US government shutdown drove the Dow Jones Industrial Average to surpass 48,000 for the first time, marking a notable divergence from the persistent weakness in the Information Technology sector.
The Dow closed +0.68% higher, up 327 points to 48,254.82, achieving its seventeenth record closing high of the year. Over the past two trading days, the blue-chip index has outperformed the technology-focused Nasdaq Composite by 2.38 percentage points, its largest margin since February. UnitedHealth Group and Goldman Sachs led the gains within the index, each rising +3.55% and +3.54%, respectively, while Nike advanced by +1.66%. In the transportation subsector, United Airlines and Delta Air Lines experienced increases of +5.29% and +4.75%, respectively.
The S&P 500 ended the session with a modest gain of +0.06%, whereas the Nasdaq Composite finished -0.26% lower.
In corporate news, Delta Air Lines reported that mandated flight reductions, which disrupted US air travel, resulted in significant financial consequences.
Chevron announced its selection of West Texas as the location for its inaugural project to supply natural gas-fired power to a data centre, signalling the commencement of a new business line designed to capitalise on the AI boom.
Anthropic disclosed plans to invest $50 billion in constructing bespoke data centres for AI across US states, including Texas and New York.
General Motors has requested that thousands of its suppliers eliminate Chinese components from their supply chains, as the automaker seeks to reduce exposure to potential geopolitical risks, according to a report from Reuters.
Siemens intends to transfer a 30% stake in Siemens Healthineers to its shareholders, thereby decreasing its involvement in the medical technology sector. The company aims to further reduce its holding in Healthineers to below 20%, reclassifying it as a financial asset to preserve flexibility for future acquisitions. This direct spinoff remains subject to regulatory and shareholder approval.
Mega caps: The Magnificent Seven had a mixed performance over the past week. Over the last seven days, Apple +1.23%, Alphabet +0.84%, and Microsoft +0.78%, while Nvidia -0.72%, Amazon -2.40%, Meta Platforms -4.24%, and Tesla -6.81%.
Energy stocks had a mostly positive performance this week, with the Energy sector itself +3.22%. WTI and Brent prices are -1.95% and -1.29%, respectively, over the past week. Over the last seven days, APA +10.30%, Marathon Petroleum +5.76%, Occidental Petroleum +5.48%, ExxonMobil +3.91%, Shell +1.59%, ConocoPhillips +1.56%, Phillips 66 +1.54%, BP +1.42%, Baker Hughes +1.04%, and Chevron +0.43%, while Halliburton -0.63%, and Energy Fuels -2.81%.
Materials and Mining stocks had a mostly positive performance this week, with the Materials sector +3.80%. Over the past seven days, Albemarle +19.97%, Sibanye Stillwater +14.19%, Newmont Corporation +14.01%, Celanese Corporation +5.90%, Freeport-McMoRan +3.98%, Nucor +2.15%, and Yara International +1.29%, while CF Industries -0.35%, and Mosaic -2.90%.
European Stock Indices Price Performance
Stoxx 600 +2.16% MTD and +15.09% YTD
DAX +1.77% MTD and +22.46% YTD
CAC 40 +1.48% MTD and +11.66% YTD
IBEX 35 +3.64% MTD and +43.30% YTD
FTSE MIB +2.93% MTD and +29.99% YTD
FTSE 100 +1.88% MTD and +21.13% YTD
This week, the pan-European Stoxx Europe 600 index is +2.16%. It was +0.71% Wednesday, closing at 584.23.
So far this month in the STOXX Europe 600, the Autos & Parts is the leading sector, +6.30% MTD and -3.20% YTD, while Technology is the weakest at -2.06% MTD and +5.01% YTD.
This week, Health Care outperformed within the STOXX Europe 600, at +5.41%, followed by Banks and Basic Resources at +5.05% and +3.90%, respectively. Conversely, Technology underperformed at -1.58%, followed by Financial Services and Industrial Goods at -0.40% and +0.18%, respectively.
Germany's DAX index was +1.22% Wednesday, closing at 24,381.46. It was +1.38% over the past seven days. France's CAC 40 index was +1.04% on Wednesday, closing at 8,241.24. It was +2.07% over the past week.
The UK's FTSE 100 index was +1.25% over the past seven days to 9,899.60. It was +1.15% on Wednesday.
As of 11th November, according to LSEG I/B/E/S data for the STOXX 600, Q3 2025 earnings are expected to increase 6.2% from Q3 2024. Excluding the Energy sector, earnings are expected to increase 6.3%. Q3 2025 revenue is expected to decrease 1.2% from Q3 2024. Excluding the Energy sector, revenues are expected to increase 0.0%. As of 11th November, 234 companies in the STOXX 600 have reported earnings for Q3 2025. Of these 234 companies, 53.0% reported results exceeding analyst estimates. In a typical quarter 54% beat analyst EPS estimates. As of 11th November, 268 STOXX 600 companies have reported revenue to date for Q3 2025. Of these, 46.5% reported revenue exceeding analyst estimates. In a typical quarter 58% beat analyst revenue estimates.
The STOXX 600 expects to see shareweighted earnings of €131.3 billion in Q3 2025 compared to share-weighted earnings of €123.5 billion (based on the year-ago earnings of the current constituents) in Q3 2024. Companies are collectively reporting earnings that are 1.4% below estimates. This figure is lower than the long-term average surprise factor of 5.8% observed since 2012.
Seven of the ten sectors in the index expect improved earnings compared to Q3 2024. The Real Estate sector has the highest earnings growth rate (175.0%) for the quarter, while the Consumer Cyclicals sector has the lowest earnings growth rate (-11.2%) of any sector. Real Estate has recorded the highest surprise factor at 191%. Conversely, Utilities has reported earnings that in aggregate are 63% lower than estimates.
The forward four-quarter price-to-earnings ratio (P/E) for the STOXX 600 sits at 14.8x. This is above the 10-year average of 14.2x.
During the week of 17th November, four companies are expected to report quarterly earnings.
Analysts anticipate positive Q3 earnings growth in thirteen of the sixteen countries comprising the STOXX 600 index. Poland, with an estimated growth rate of 69.5%, and Ireland, at 25.2%, are projected to have the highest earnings growth, whereas Denmark and Norway are expected to experience the most significant declines, estimated at -19.8% and -15.7%, respectively.
In Wednesday's trading session, the Autos & Parts sector emerged as the best performer. Ferrari advanced after JPMorgan initiated coverage with an Overweight rating, citing the company's robust transition to EVs and sustained pricing power projected through 2030. Banks also traded higher, as ABN AMRO Bank rose following a Q3 earnings beat and the announcement of its acquisition of NIBC Bank, which will enhance its position in the Dutch retail market; the bank reported a Common Equity Tier 1 (CET1) ratio of 14.8%.
Within Construction & Materials, FLSmidth’s shares rose after surpassing Q3 profit expectations and raising its full-year guidance despite order delays, while Jungheinrich advanced even though its Q3 net income fell short of consensus; the company reaffirmed its guidance for fiscal year 2025. Marshalls slightly higher after reporting a 2% y/o/y increase in revenue for the first ten months, keeping its full-year outlook unchanged.
The Health Care sector moved higher, driven by Bayer’s strong EPS beat; weaker results in the Consumer Health segment were offset as the overall guidance remained unchanged. Chemicals also outperformed as Brenntag advanced on a Q3 earnings beat and announced a strategic review. Voestalpine delivered strong Q3 EPS and maintained its full-year guidance. Additionally, BASF shares advanced following the listing of its Agricultural Solutions division on the Frankfurt exchange.
Conversely, Real Estate underperformed despite Samhallsbyggnadsbolaget I Norden asset-sale gains. Taylor Wimpey came under pressure due to softness in the UK housing market, reporting a net private sales rate of 0.63, though its full-year 2025 outlook remains stable.
Energy also declined, as E.ON traded lower after missing nine-month income estimates; however, its full-year guidance was unchanged, while RWE advanced on the back of Q3 results. Additionally, Financial Services lagged as Edenred reduced its 2026 guidance. EQT was modestly lower following the partial sale of its stake in Azelis.
Other Global Stock Indices Price Performance
MSCI World Index +0.57% MTD and +19.08% YTD
Hang Seng +3.92% MTD and +34.21% YTD
The MSCI World Index is +1.34% over the past 7 days, while the Hang Seng Index is +3.81% over the past 7 days.
Currencies
EUR +0.55% MTD and +11.96% YTD to $1.1592
GBP -0.16% MTD and +4.93% YTD to $1.3130
The dollar index rose +0.02% to 99.47, but has declined -0.69% over the past seven days. The dollar index is -0.24% MTD.
The euro advanced +0.10% against the dollar on Wednesday to $1.1592, contributing to a gain of +0.88% over the past seven days.
The British pound retreated by -0.15% against the dollar to $1.3130 on Wednesday. Over the week, sterling increased by +0.61%.
The British pound declined for a second consecutive day following the release of soft labour market data and media reports suggesting Prime Minister Keir Starmer may face an attempted leadership challenge.
Market participants currently estimate a 75% likelihood of a quarter-point reduction in borrowing costs by the BoE in December, following Tuesday's labour market report, which indicated an uptick in the unemployment rate to 5%.
The US dollar advanced +0.42% against the Japanese yen to ¥154.80 on Wednesday. Over the past seven days, the yen has declined by -0.45%, contributing to a -0.52% drop this month. Year-to-date, the US dollar is up +1.34% against the Japanese yen.
On Wednesday, Japanese Prime Minister Sanae Takaichi reiterated her administration's preference for maintaining low interest rates and emphasised the importance of close coordination with the Bank of Japan. She also requested that BoJ Governor Kazuo Ueda provide regular updates to the government's Council on Economic and Fiscal Policy.
Additionally, Japanese Finance Minister Satsuki Katayama issued a verbal warning regarding the yen's recent weakness as it approached ¥155, characterising recent movements in the foreign exchange market as ‘one-sided and rapid.’
Note: As of 5:00 pm EST 12 November 2025
Fixed Income
US 10-year yield -0.4 bps MTD and -50.1 bps YTD to 4.075%
German 10-year yield +1.3 bps MTD and +27.8 bps YTD to 2.647%
UK 10-year yield -6.2 bps MTD and -16.5 bps YTD to 4.403%
US Treasuries advanced on Wednesday, resulting in lower yields, as investors interpreted Treasury Secretary Scott Bessent’s remarks as supportive of the longer end of the curve. This came even as ongoing concerns about the labour market contributed to the rally.
At the New York Fed US Treasury Market Conference on Wednesday, Secretary Bessent stated that auction sizes for coupon-bearing securities — including notes and bonds — will remain unchanged for the next several quarters. This signals a stable supply environment and suggests that prices for government debt may remain firm, helping to keep yields subdued.
Additionally, Secretary Bessent voiced support for reforms to the supplementary leverage ratio (SLR), which requires banks to maintain capital against their investments regardless of risk, thereby discouraging them from holding Treasuries. The Fed had temporarily suspended the SLR in March 2020 during a market disruption but allowed the relief to expire a year later. Reducing the SLR would provide banks with greater balance sheet capacity, enabling them to hold more low-risk assets such as Treasuries without the need to allocate additional capital for potential losses.
Also on Wednesday, the US Treasury issued $42 billion in new 10-year notes. Demand was slightly softer compared to previous auctions, as reflected by the pricing at 4.074%—marginally higher than the anticipated rate at the bidding deadline. The bid-to-cover ratio registered at 2.43x, below last month’s 2.48x. Indirect bidders, which include foreign investors, received 67.0% of the allocation, up from the previous 66.8%, but still trailing the 70.1% average.
During afternoon trading, the yield on the 10-year Treasury note declined by -4.6 bps to 4.075%, while the 30-year yield fell -4.0 bps to 4.668%. Shorter-dated securities also saw movement, with the two-year yield slipping -2.5 bps to 3.576%.
Over the past seven days, the yield on the 10-year Treasury note was -8.5 bps lower. The yield on the 30-year Treasury bond declined by -6.6 bps. On the shorter end, the two-year Treasury yield was -6.2 bps lower.
The yield curve saw a modest flattening over the past week, as the spread between the two-year and 10-year Treasury yields narrowed from 52.2 bps to 49.9 bps.
Traders are pricing in 15.0 bps of cuts by year-end, slightly lower than last week’s 15.5 bps, according to CME Group's FedWatch Tool. Fed funds futures traders are now pricing in a 60.1% probability of a 25 bps rate cut at December’s FOMC meeting, lower from 62.0% last week.
Across the Atlantic, in the UK, on Wednesday the 10-year gilt was +1.2 bps to 4.403%. Over the past seven days, it declined -6.2 bps.
Eurozone government bond yields declined modestly on Wednesday. European government bonds have seen limited activity recently as there are few domestic drivers and the ECB is expected to keep policy steady.
On the issuance front, the German government is set to auction approximately €2.5 billion in long-term debt maturing in 2046 and 2056.
The yield on the German 10-year Bund settled at 2.647%, reflecting a decrease of -1.6 bps on Wednesday, and remaining below the recent one-month high of 2.699% recorded earlier in the week. The two-year Schatz — typically more sensitive to changes in inflation expectations and monetary policy outlook — was -0.1 bps lower to 2.008%. At the longer end, the 30-year Bund yield declined by -2.5 bps to 3.229%.
The yield spread between German Bunds and 10-year UK gilts reached 175.6 bps on Wednesday and was 3.2 bps narrower over the past week.
The 10-year French yield was -3.8 bps, to 3.385% on Wednesday. The yield spread between French and German 10-year government bonds was 4.4 bps narrower from the previous week's 78.2 bps, settling at 73.8 bps.
Over the past seven days, the German 10-year yield was -3.0 bps. Germany's two-year bond yield was -1.0 bps, and, on the longer end, Germany's 30-year yield was -3.2 bps.
The spread between US 10-year Treasuries and German Bunds is now 142.8 bps, a contraction of 5.5 bps from last week’s 148.3 bps.
The spread between Italian BTP 10-year yields and German Bund 10-year yields stood at 73.0 bps, a 46.9 bps contraction from 119.9 bps last week. The Italian 10-year yield was -49.9 bps over the last week, after trading -2.8 bps lower on Wednesday to 3.377%.
Commodities
Gold spot +4.84% MTD and +59.89% YTD to $4,195.31 per ounce
Silver spot +9.49% MTD and +84.40% YTD to $53.27 per ounce
West Texas Intermediate crude -3.94% MTD and -18.81% YTD to $58.48 a barrel
Brent crude -3.61% MTD and -16.02% YTD to $62.72 a barrel
Gold prices advanced by more than 1.5 percent on Wednesday, supported by a decline in US Treasury yields ahead of the House vote on reopening the government.
Spot gold increased by +1.68% to $4,195.31 per ounce, marking its highest level since 21st October. Gold prices are +5.44% up over the last seven days, and have risen +4.84% so far this month.
Year-to-date, gold prices have risen +59.89% due to a combination of factors such as escalating geopolitical tensions, expectations of monetary easing, increased central bank purchases, efforts toward de-dollarisation, and robust ETF inflows.
Oil prices declined by more than three percent on Wednesday, pressured by an OPEC report indicating that global oil supply is expected to meet demand by 2026. This represents a notable shift from the organisation’s previous forecasts, which had anticipated a supply deficit.
Brent crude futures settled at $62.72 per barrel, reflecting a decrease of $2.43, or -3.73%. Similarly, US WTI crude closed at $58.48 per barrel, down $2.40, or -3.94%. This week, WTI and Brent prices are down -1.95% and -1.29%, respectively.
Analysts have emphasised that an oversupply of crude is restraining further price increases. Earlier this month, OPEC+ agreed to halt any additional output increases during Q1 2026, following the reversal of production cuts that had been in place since August.
The US Energy Information Administration report on inventories is scheduled to be released today, due to the Veterans Day holiday on Tuesday.
OPEC report. According to OPEC’s Monthly Oil Market Report released on Wednesday, the global oil market is projected to experience a modest surplus in 2026, following increased production from OPEC+ members and higher output from other suppliers.
This development marks a significant departure from OPEC’s previous outlook, which anticipated a supply deficit. In its latest monthly report, OPEC noted that OPEC+ production in October reached 43.02 million bpd, representing a decrease of 73,000 bpd compared to September, despite the group’s agreement to raise output for the month—a reduction largely attributed to lower production in Kazakhstan.
OPEC now expects demand for OPEC+ crude to average 43.0 million bpd in 2026. If the group maintains its current output levels, this would result in a slight market surplus of 20,000 bpd. This forecast underscores a continued shift from OPEC’s earlier assessments: last month’s report predicted a 50,000 bpd deficit, while the September report indicated a shortfall of 700,000 bpd. The organisation has also revised its 2026 demand forecast for OPEC+ crude downward by 100,000 bpd, following an upward adjustment in anticipated 2025 production from non-OPEC+ producers.
OPEC’s demand projections remain at the higher end compared to other industry estimates, including those of the IEA. OPEC’s previous expectation of a 2026 supply deficit stands in contrast to the IEA’s more conservative outlook.
IEA World Energy Outlook. According to the International Energy Agency (IEA), global demand for oil and gas may continue to increase until 2050, signalling a shift from earlier projections that anticipated a rapid transition to cleaner energy sources. This change follows recent criticism from the US regarding the IEA's climate focus.
In its annual World Energy Outlook released on Wednesday, the Paris-based agency also warned that the world is unlikely to achieve its target of limiting temperature rises to as close as possible to 1.5 degrees Celsius (2.7 degrees Fahrenheit) above pre-industrial levels, a threshold considered crucial to averting the worst impacts of climate change.
The IEA's current policies scenario, which is grounded in existing government measures rather than aspirational climate objectives, projects that oil demand will reach 113 million bpd mid-century—an increase of approximately 13% compared to 2024 levels. Furthermore, global energy demand is expected to rise by 90 exajoules by 2035, representing a 15% increase from present figures. This scenario marks a return to the methodology first employed by the IEA in 2019 before it shifted focus to scenarios aligned with clean energy transitions.
The IEA's outlook contrasts with its previous forecasts, which anticipated that global oil demand would peak within this decade.
The report also highlighted a surge in final investment decisions for new liquefied natural gas (LNG) projects in 2025. Approximately 300 billion cubic meters of new annual LNG export capacity are projected to commence operations by 2030, reflecting a 50% increase in available supply. Under the current policies scenario, the global LNG market is expected to expand from about 560 billion cubic meters in 2024 to 880 billion cubic meters in 2035, and to 1,020 billion cubic meters by 2050, driven largely by increased power sector demand associated with the growth of data centres and AI.
Additionally, global investment in data centres is forecasted to reach $580 billion in 2025. If realised, this level of investment would exceed the $540 billion spent annually worldwide on oil supply, underscoring the growing importance of data infrastructure in the evolving energy landscape.
Note: As of 5:00 pm EST 12 November 2025
Key data to move markets
EUROPE
Thursday: Eurozone’s Economic Bulletin, Industrial Production, and a speech by ECB Board Member Frank Elderson
Friday: French Consumer Price Index (CPI), Spanish CPI and Harmonised Index of Consumer Prices, Eurozone GDP, Employment Change, European Commission’s Economic Growth Forecasts, and speeches by Bank of Spain Governor José Luis Escrivá, ECB Board Member Frank Elderson, and ECB Chief Economist Philip Lane
Saturday: A speech by ECB Executive Board Member Isabel Schnabel
Monday: Italian CPI and Buba Monthly Report
Wednesday: Non-Monetary Policy ECB Meeting, Eurozone’s Current Account, Harmonised Index of Consumer Prices, and Core Harmonised Index of Consumer Prices
UK
Thursday: GDP, Industrial Production, Manufacturing Production, and a speech by BoE’s MPC External Member Megan Greene
Monday: A speech by BoE’s MPC External Member Catherine Mann
Tuesday: Speeches by BoE’s Chief Economist Huw Pill, and MPC External Member Swati Dhingra
Wednesday: CPI, Core CPI, Producer Price Index (PPI) Output and Input, PPI Core Output, and Retail Price Index
USA
Thursday: Initial and Continuing Jobless Claims, CPI, Core CPI, Monthly Budget Statement, and speeches by San Francisco Fed President Mary Daly, Minneapolis Fed President Neel Kashkari, St. Louis Fed President Alberto Musalem, and Cleveland Fed President Beth Hammack
Friday: PPI, Core PPI, Retail Sales, and speeches by Kansas City Fed President Leff Schmid, Dallas Fed President Lorie Logan, and Atlanta Fed President Raphael Bostic
Monday: New York Empire State Manufacturing Index, and speeches by New York Fed President John Williams, and Minneapolis Fed President Neel Kashkari
Tuesday: ADP Employment Change 4-week average, and Industrial Production
Wednesday: FOMC Minutes, Building Permits, Housing Starts, and a speech by New York Fed President John Williams
CHINA
Thursday: Industrial Production, and Retail Sales
Wednesday: PBoC Interest Rate Decision
JAPAN
Sunday: GDP
Tuesday: Adjusted Merchandise Trade Balance, Exports, Imports, and Merchandise Trade Balance Total
GLOBAL
Saturday-Sunday: G20 Meeting
Global Macro Updates
US federal government: back online. The longest federal government shutdown in US history is set to conclude following the House of Representatives’ approval of a new funding measure. The Republican-led House voted 222 to 209 in favour of legislation to reopen the federal government and provide funding through the end of January, after the bill was first passed by the Senate on Monday. The White House announced that President Donald Trump would sign the bill into law on Wednesday night.
This anticipated resolution comes after a 43-day stalemate that resulted in thousands of federal employees being furloughed, significant disruptions to welfare programmes, and considerable turmoil at airports. Over the coming days, government services are expected to resume operations, and restrictions on US air travel will gradually be lifted.
Republican Speaker Mike Johnson advanced the bill through the House, overcoming his party’s narrow majority in the chamber. All but two Republicans voted in favour, joined by six Democrats representing districts won by President Trump in last year’s presidential election. The legislation extends government funding through 30 January, continuing the trajectory of adding approximately $1.8 trillion annually to the federal government’s $38 trillion debt.
The vote occurred eight days after Democrats secured several notable election victories. Lawmakers reached the deal during closed-door negotiations between Democratic and Republican senators over the weekend. The agreement reverses the layoffs of federal employees imposed by the White House and guarantees that furloughed workers will receive back pay.
Despite its passage, the agreement was contentious among Democratic lawmakers, with many alleging that senators had capitulated to the US President and Republican demands. For six weeks, Democrats maintained that reopening the government was contingent on restoring healthcare tax credits set to expire at year’s end. The final deal does not secure these credits but instead provides for a vote on the matter next month. Speaker Mike Johnson has not committed to allowing a vote in the House.
This shutdown was significantly longer than the previous 35-day record set during President Trump’s first term. The shutdown resulted in diminished public services and threatened benefits for low-income Americans, including the more than 40 million individuals who depend on the Supplemental Nutrition Assistance Program for food assistance.
The prolonged impasse on Capitol Hill also disrupted the nation’s air travel, with air traffic controllers calling in sick. Last week, the Federal Aviation Administration ordered airlines to reduce flights in response to the ongoing situation.
Fedspeak: Boston Fed Collins raises the bar. Boston Fed President Susan Collins, who supported both of this year’s policy-rate reductions, stated on Wednesday that there is a ‘relatively high bar’ for further monetary easing in the near future, citing concerns regarding persistent inflation.
In remarks prepared for the 24th Annual Regional & Community Bankers Conference in Boston, Collins emphasised, ‘Absent clear evidence of significant labour market deterioration, I would be reluctant to pursue additional policy easing, particularly given the limited inflation data resulting from the government shutdown.’
Collins further noted, ‘It will likely be appropriate to maintain policy rates at their current level for some time to appropriately balance the risks related to inflation and employment in this highly uncertain environment.’ Her comments highlight the growing divisions within the FOMC and the absence of consensus regarding another rate cut—issues that Fed Chair Jerome Powell acknowledged two weeks ago.
Although the most recent interest-rate reduction received strong support, Powell cautioned that another cut at the Fed’s December meeting is ‘not a foregone conclusion.’ The quarter-point reduction in October was met with two dissents.
Since then, several of the Fed’s twelve voting members—including Collins—have expressed increased caution toward further rate cuts. St. Louis Fed President Alberto Musalem voiced concerns about policy becoming overly accommodative, and Vice Chair Philip Jefferson advised a measured approach given the lack of official data during the recent US government shutdown.
Among non-voting members, Atlanta Fed President Raphael Bostic has also recommended holding rates steady due to inflation risks, while others, such as San Francisco Fed President Mary Daly, advocate maintaining flexibility and remaining open-minded about future policy decisions.
While every effort has been made to verify the accuracy of this information, LHCM Ltd. (hereafter known as “EXANTE”) cannot accept any responsibility or liability for reliance by any person on this publication or any of the information, opinions, or conclusions contained in this publication. The findings and views expressed in this publication do not necessarily reflect the views of EXANTE. Any action taken upon the information contained in this publication is strictly at your own risk. EXANTE will not be liable for any loss or damage in connection with this publication.
Ten artykuł jest publikowany wyłącznie w celach informacyjnych i nie powinien być traktowany jako oferta lub zachęta do kupna lub sprzedaży jakichkolwiek inwestycji lub powiązanych usług, do których można się tu odwołać. Obrót instrumentami finansowymi wiąże się ze znacznym ryzykiem strat i może nie być odpowiedni dla wszystkich inwestorów. Wyniki osiągnięte w przeszłości nie są wiarygodnym wskaźnikiem wyników w przyszłości.


Zarejestruj się i otrzymuj informacje rynkowe
Zarejestruj się i otrzymuj
informacje
rynkowe
Subskrybuj teraz

Stworzone przez profesjonalistów. Dla profesjonalistów.
