

Is the price signal more important than the slowdown?


 S&P 500 +0.66% to 7,773.95 US 10-year yield +2.9 basis points to 5.312% Spot gold -0.06% to $4,139.70 an ounce DXY +0.19% to 102.12
Key data to move markets today
EU: Eurozone Retail Sales and speeches by ECB Executive Board members Piero Cipollone and Frank Elderson
UK: A speech by BoE MPC external member Catherine Mann
USA: Speeches by New York Fed President John Williams and Fed Governor Michelle Bowman
JAPAN: A speech by BoJ Governor Kazuo Ueda
Global Macro Updates
ISM says the quiet part loudly. September’s ISM services report offered investors a familiar yet uncomfortable combination of softer growth, firmer hiring and more persistent price pressure. The composite edged down to 54.9 from 55.4, missing the 55.0 consensus, while recording its 27th consecutive expansion. Business Activity fell 5.2 points to 56.5 and New Orders eased to 59.8. Deceleration, but hardly weakness.
Employment rose 2.3 points to 50.1, returning to expansion after two contracting months as orders and backlogs supported hiring. Prices Paid climbed to 74.0, the highest since July 2022. Fuel increased for an eighth month and was cited twice as often as any other performance issue. Tariffs and supply-chain friction were also mentioned.
Still, a lofty ISM price reading should not be translated mechanically into CPI or PCE. Cleveland Fed research found that the manufacturing ISM prices index improved one-month-ahead PPI forecasts by about 7 per cent, with most value inside six months, but added no forecasting power for headline or core PCE. A Fed text-based measure nevertheless regards ISM comments as useful for nowcasting input pressure because they arrive roughly two weeks before PPI.
The clearer signal is upstream inflation and rates, not consumer inflation. New York Fed research identifies ISM manufacturing as one of the few releases with a persistent asset-price effect, strongest in interest rates and weakest in equities. Energy, transport and margin-sensitive consumer businesses face the clearest cost threat. Conversely, capital goods and diversified financials provide the purer cyclical-growth exposure; rate-sensitive real estate, utilities and long-duration technology look more vulnerable if price pressure keeps policy expectations higher for longer.
S&P Global’s survey told a hotter story. US services activity reached its strongest pace since July 2021. Hiring accelerated to the fastest since June 2022 and input-cost inflation hit its highest since November 2022, led by gas, transport and labour. The headline divergence matters: demand remains healthy enough for firms to absorb higher costs and, perhaps, pass them on.
The fuller US September PMI detail was more emphatic. Technology remained the strongest-performing sector, while consumer services, industrials and healthcare all accelerated. New orders grew at their fastest pace in more than four years and hiring was the strongest since June 2022. However, backlogs increased for a 19th consecutive month, suggesting capacity has yet to catch up with demand. Input costs rose at the fastest pace since November 2022, driven by gas and labour, while selling-price inflation was the second-highest in just over a year. For investors, that combination favours operationally geared cyclicals and technology on growth, but creates duration risk for richly valued equities and margin pressure for labour-, transport- and energy-intensive businesses.
Europe offered a striking divergence. The eurozone Composite PMI rose to a 41-month high of 53.1 and services reached a 10-month high of 53.0. Every surveyed economy expanded for the first time since November. New orders grew at their fastest pace in 41 months, backlogs increased for the first time since June 2022 and firms resumed hiring. However, services charges rose at the sharpest pace since February 2024, complicating the ECB’s easing calculus. UK Services PMI eased to 52.1 from 52.5 and new-order growth was the weakest since July, while export business declined for a seventh month. Employment has now fallen for two years, although September’s decline was the smallest since October 2025. Fuel and payroll costs lifted input inflation to a three-month high and prompted the fastest increase in services charges since May. This mix leaves UK domestic cyclicals and gilts more exposed than their eurozone counterparts.
US Stock Indices
Dow Jones Industrial Average +0.18%
Nasdaq 100 +0.87%
S&P 500 +0.66%, with 10 of the 11 sectors of the S&P 500 up
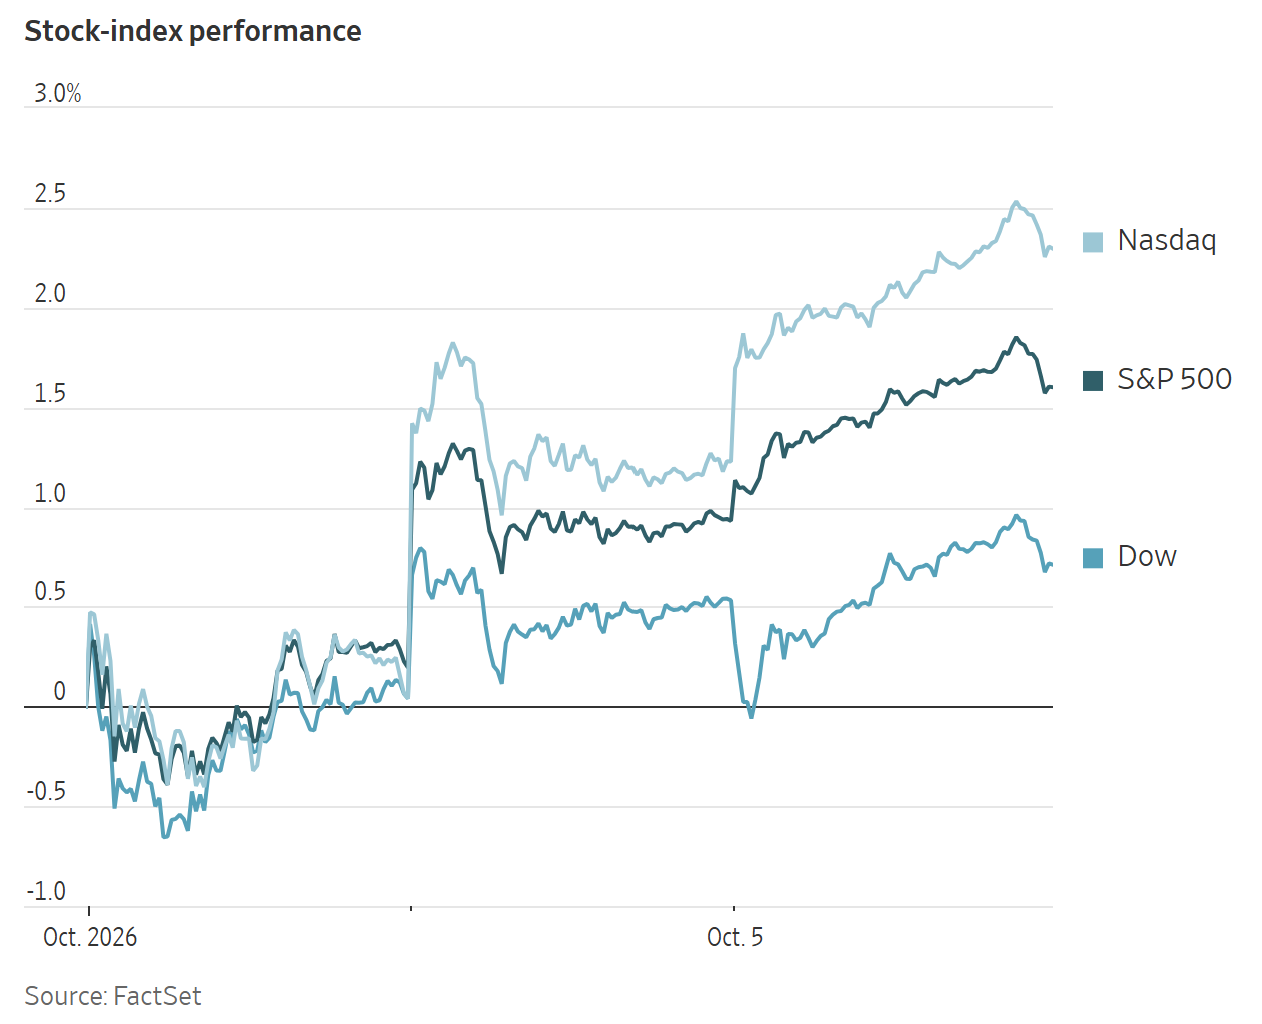
On Monday, the Nasdaq Composite closed at 27,477.41, one percent above its previous record set in September, and +1.05% higher on the day. The S&P 500 gained +0.66%, ending less than one percent below its all-time high. The Dow industrials rose +0.18%, or 90.84 points, to 51,267.90.
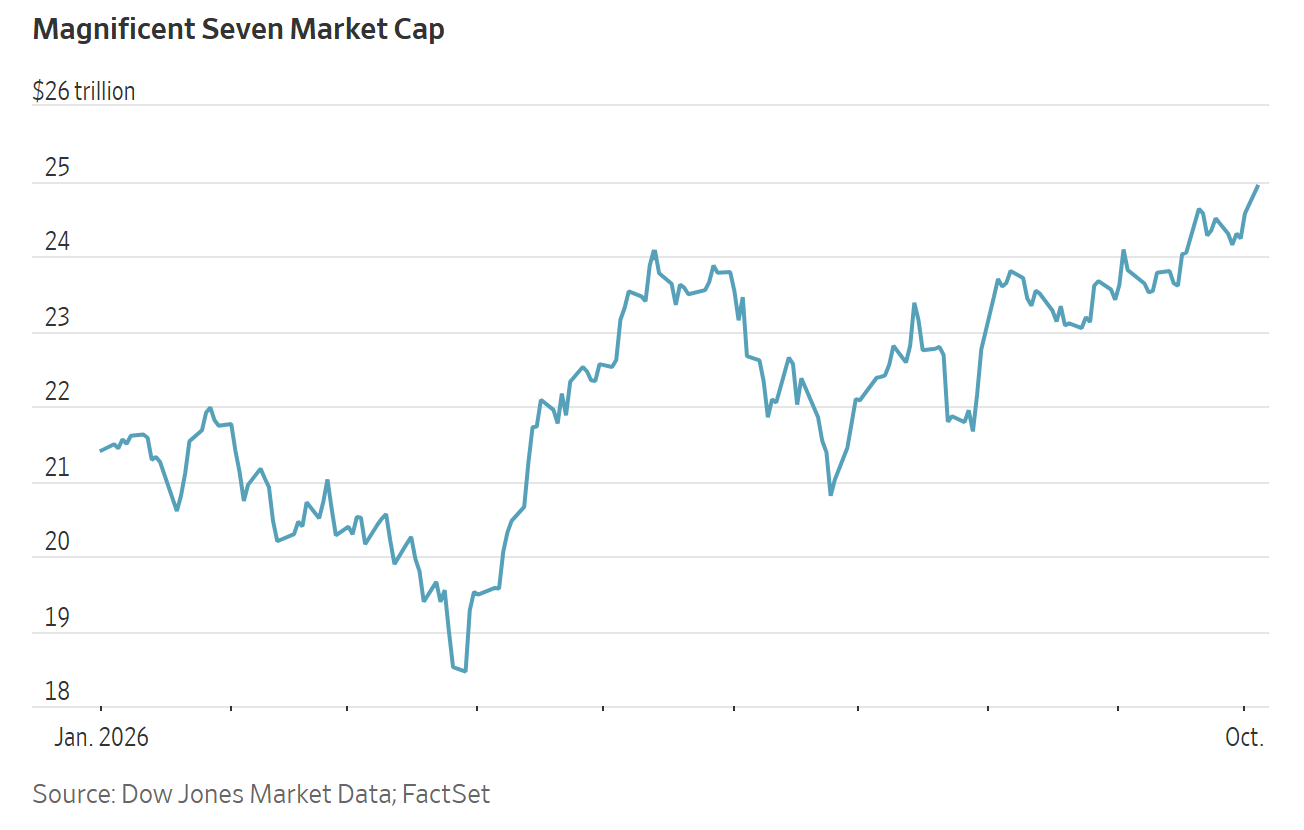
The Magnificent Seven led stocks higher. Nvidia closed at a record high for the first time since May, while memory-related stocks such as Western Digital and Seagate Technology ranked among the S&P 500's top performers. The Magnificent Seven also reached a record combined market capitalisation of $24.836 trillion.
Nvidia, the world's largest company by market capitalisation, rose +2.12% to a record closing price of $238.90, lifting its market value to $5.76 trillion.
Microsoft is again approaching a $4 trillion market capitalisation after its shares rose +1.48% to $525.18, their highest close since last October.
In corporate news, Bloomberg news reported that SpaceX has proposed building a natural gas pipeline in Florida to supply its Cape Canaveral facilities with fuel for Starship launches. The company would liquefy the gas for use as rocket propellant, replacing current truck deliveries of liquefied natural gas. Starship runs on liquid methane, the main component of natural gas.
CH Robinson agreed to acquire trucking brokerage RXO in a cash-and-stock transaction valued at about $5.8 billion, betting that AI can improve efficiency in a difficult freight market. The acquisition would diversify CH Robinson's business and expand its expedited and last-mile delivery capabilities. Expected to close in the first half of 2027, the deal would strengthen CH Robinson's position as North America's largest broker by revenue, with RXO shareholders owning about 11% of the combined company.
European Stock Indices
CAC 40 -0.80%
DAX -0.16%
FTSE 100 +0.34%
Commodities
Gold spot -0.06% to $4,139.70 an ounce
Silver spot +0.92% to $60.95 an ounce
West Texas Intermediate -2.14% to $89.30 a barrel
Brent crude -2.33% to $100.34 a barrel
Gold prices edged lower on Monday due to a stronger dollar.
Spot gold slipped -0.06% to $4,139.70 per ounce.
By contrast, spot silver rose +0.92% to $60.95 per ounce.
Crude benchmarks closed lower as traders assessed the potential release of crude and diesel stockpiles by G7 nations, Saudi Aramco's price cuts, improving Middle Eastern crude exports and heightened tensions between Yemen's Houthis and Saudi Arabia.
On Monday, Brent settled $2.39 lower, or -2.33%, at $100.34 per barrel. WTI finished $1.95 lower, or -2.14%, at $89.30 per barrel.
Iranian state media reported that President Masoud Pezeshkian said negotiations with the US were meaningless and had only led to renewed attacks. Separately, according to Bloomberg news, President Trump is preparing to ease restrictions on the use of a tax-exempt diesel variety to reduce elevated fuel costs.
CBS News reported that Saudi-backed government forces announced a new operation to retake Yemen's capital, Sanaa. Meanwhile, a Houthi-affiliated group warned airlines on Monday against operating in Saudi Arabian airspace.
Reuters reported that Saudi Arabia unexpectedly cut its November oil prices for Asia to six-year lows while raising prices for northwest Europe and the Mediterranean. Saudi Aramco lowered the November official selling prices for Arab Medium and Arab Heavy crude sold to Asia by $5 per barrel, while increasing prices for all grades sold to northwest Europe by $3 per barrel.
Kpler and Vortexa shipping data showed that crude exports from the Middle East Gulf returned to pre-war levels in September despite attacks on vessels crossing the Strait of Hormuz. Cargo volumes reportedly exceeded pre-war levels on 14 days during the month, including shipments through the Strait of Hormuz and the Red Sea, as well as exports from regional terminals.
Reuters reported that industry executives said global oil prices could remain elevated beyond this year, as shipping bottlenecks, sharp refinery output cuts and inventory draws may take years to reverse.
Russia exported 4.088 million bpd of seaborne crude in September, up 8% m/o/m and 3% y/o/y despite ongoing sanctions, according to ship-tracking data from S&P Global Energy. Russian seaborne crude exports to India fell 59% m/o/m and 51% y/o/y to 816,000 bpd, while shipments to China increased 22% m/o/m and 27% y/o/y to 1.415 million bpd.
The DOE reported that strategic petroleum reserves stood at 283.0 million barrels in the week ended 2 October, down 0.8 million barrels w/o/w.
Note: As of 4 pm EDT 5 October 2026
Currencies
EUR -0.31% to $1.1218
GBP -0.18% to $1.3217
Bitcoin +1.68% to $85,940.22
Ethereum +1.99% to $2,717.59
The euro hovered near a 17-month low on Monday, pressured by political uncertainty and fiscal concerns across the euro area, while the dollar extended its rally on the back of higher US Treasury yields.
The euro fell -0.31% to $1.1218, its lowest level since May 2025, extending last week's 1.21% decline.
The euro was particularly affected by growing concerns over France’s high debt levels and political gridlock, compounded by an upcoming snap election in Spain.
The dollar continued to strengthen on Monday, supported by persistently elevated US Treasury yields that reached multi-decade highs overnight. The dollar index gained +0.19% to 102.12, an 18-month high.
The dollar rose +0.04% against the yen to ¥157.89, while sterling fell -0.18% to $1.3217.
Fixed Income
US 10-year Treasury +2.9 basis points to 5.312%
German 10-year Bund +3.1 basis points to 3.506%
UK 10-year Gilt +6.0 basis points to 5.429%
US Treasury yields mostly advanced on Monday, with the 10-year and 30-year yields reaching fresh 24-year highs as negative bond-market sentiment persisted and investors assessed the outlook for higher rates.
Yields remained elevated after data suggested inflation could stay high into 2027. The Institute for Supply Management reported that US services activity slowed in September, while robust domestic demand strained supply chains and pushed its input-price index to the highest level in more than four years.
According to CME Group's FedWatch Tool, traders assigned a 76.2% probability to the Fed leaving rates unchanged at its 27 - 28 October meeting and an 86.7% probability to a rate increase in December.
Investors will also monitor upcoming Treasury auctions, including today's three-year sale. Weak demand at auctions last month contributed to the recent bond selloff.
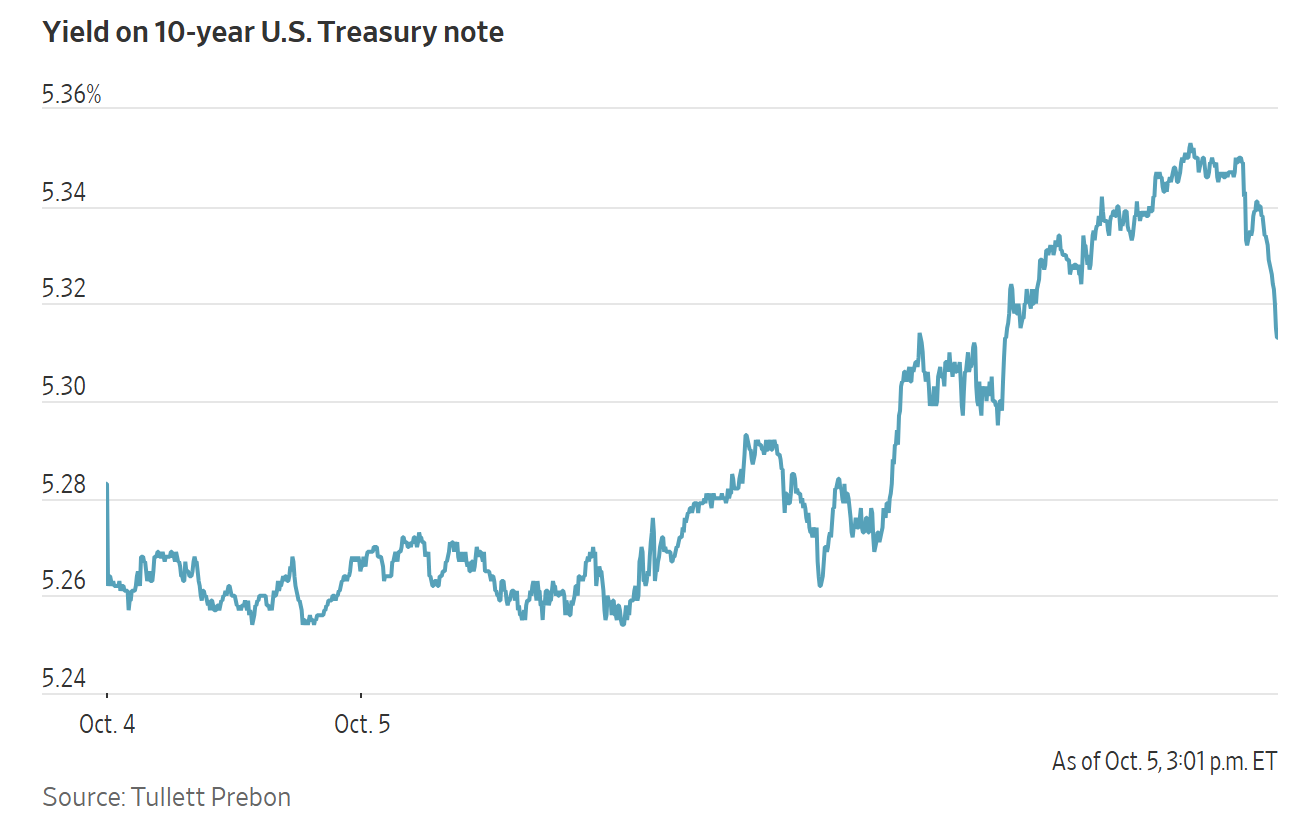
The US 10-year Treasury yield ended the session +2.9 bps to 5.312% after reaching 5.349% earlier in the day, a fresh 24-year high. The 30-year yield ended the day +5.1 bps to 5.665%. It had touched 5.703% earlier in the session, also a fresh 24-year high.
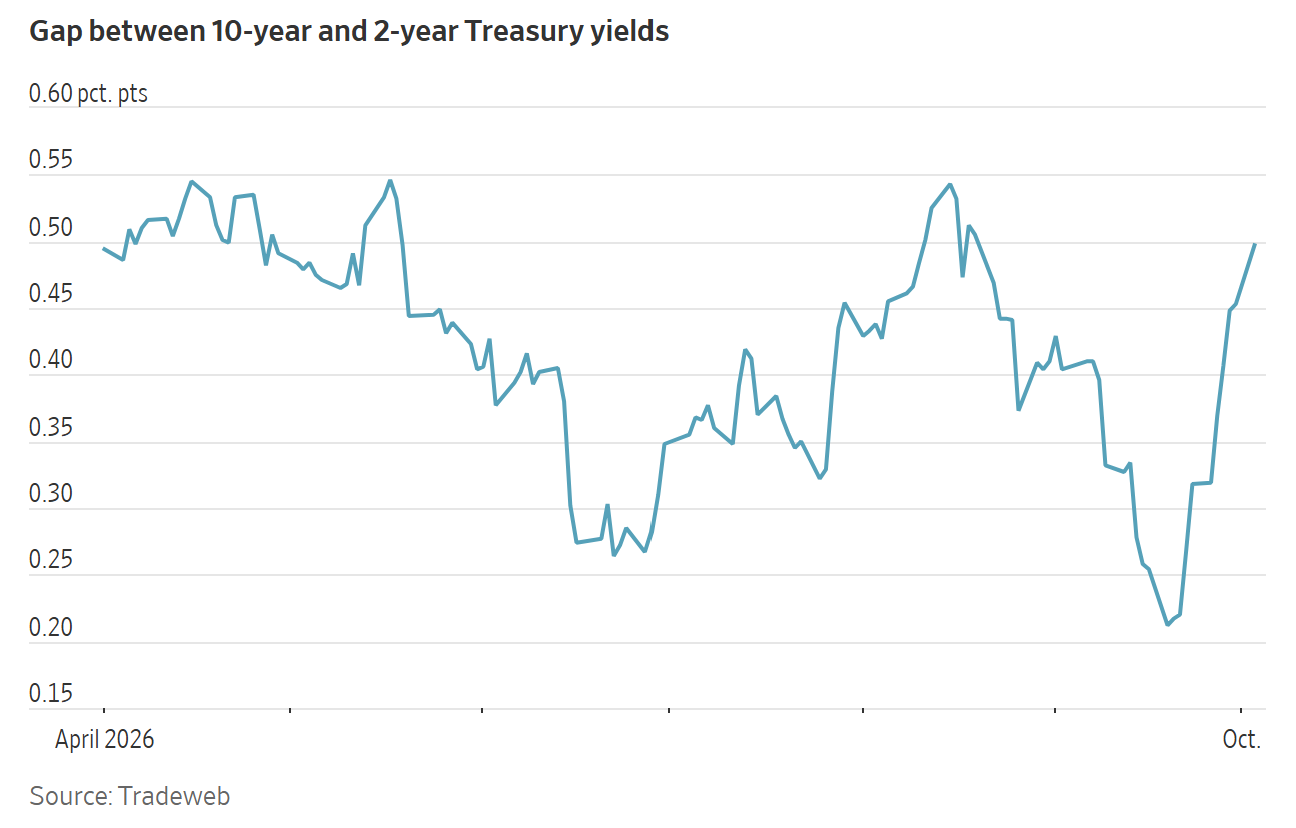
The US 2s10s yield curve stood at 48.9 bps, 4.5 bps wider than on Friday, after reaching 49.7 bps earlier in the session, its steepest level since 21 August.
The US two-year Treasury yield, which typically tracks expectations for the Fed funds rate, fell -1.6 bps to 4.823%.
The selloff in US Treasurys has persisted for months, although it has progressed through several distinct phases.
Only a few weeks ago, short-term Treasury yields were rising much faster than long-term yields as expectations intensified over how high the Fed would lift policy rates. That trend has shifted in recent days. Since 23 September, the 10-year yield has climbed by more than 20 bps, while the two-year yield has fallen 4 bps, steepening the curve.
A key turning point came on 29 September, when New York Fed President John Williams indicated that an October rate increase was likely unnecessary. Traders have since reduced bets on an October move, keeping short-term yields contained, while elevated energy prices and signs of resilient economic growth have continued to exert upward pressure on longer-term yields.
French bonds found some relief on Monday, with yields broadly steady and the spread over German borrowing costs narrowing after widening 26.5 bps the previous week.
Germany's 10-year Bund yield rose +3.1 bps to 3.506%, while the equivalent French OAT yield edged up +0.01 bps to 4.867%. The spread narrowed 3.0 bps to 136.1 bps.
The two-year Schatz yield fell -1.6 bps to 3.075%. At the long end of the German curve, the 30-year yield rose +4.8 bps to 3.868%.
Italy's 10-year BTP yield rose +3.8 bps to 4.642%, leaving its spread over Bunds at 113.6 bps.
Markets assigned only a 20% probability to an ECB rate increase at its October meeting and around an 80% probability to a rise by December.
Bond investors also assessed a new political development after Spanish Prime Minister Pedro Sánchez called a snap election for 29 November. The move is intended to strengthen his mandate after a fragmented parliament rejected the government's housing decrees last week amid widespread protests.
Spain's 10-year government bond yield rose +5.8 bps to 4.145%, underperforming its European peers.
Note: As of 4 pm EDT 5 October 2026
While every effort has been made to verify the accuracy of this information, EXT Ltd. (hereafter known as “EXANTE”) cannot accept any responsibility or liability for reliance by any person on this publication or any of the information, opinions, or conclusions contained in this publication. The findings and views expressed in this publication do not necessarily reflect the views of EXANTE. Any action taken upon the information contained in this publication is strictly at your own risk. EXANTE will not be liable for any loss or damage in connection with this publication.
Ten artykuł jest publikowany wyłącznie w celach informacyjnych i nie powinien być traktowany jako oferta lub zachęta do kupna lub sprzedaży jakichkolwiek inwestycji lub powiązanych usług, do których można się tu odwołać. Obrót instrumentami finansowymi wiąże się ze znacznym ryzykiem strat i może nie być odpowiedni dla wszystkich inwestorów. Wyniki osiągnięte w przeszłości nie są wiarygodnym wskaźnikiem wyników w przyszłości.
 Wróć do wszystkich informacji




Zarejestruj się i otrzymuj informacje rynkowe
Zarejestruj się i otrzymuj
informacje
rynkowe
Subskrybuj teraz Subskrybuj teraz


Stworzone przez profesjonalistów. Dla profesjonalistów.
