
Who actually controls the Strait of Hormuz?

Global Macro Updates
What’s the timeline for the inflation pulse? US-Iran tensions are refusing to cool and markets are pricing in a scenario that was considered tail risk just two months ago: the Strait of Hormuz stays closed not for weeks, but for quarters. With negotiations effectively deadlocked, Tehran insisting the US lift its naval blockade before talks even begin and the White House waiting on a fractured Iranian leadership to present a unified proposal, the pathway to de-escalation remains murky at best. Reuters reported this week that the US Navy intercepted at least three Iranian-flagged oil tankers in Asian waters, extending the blockade's reach well beyond the Gulf, while US Central Command (CENTCOM) confirmed it has turned around 29 vessels since the operation began. The Pentagon estimates mine-clearing alone could take up to six months, meaning even an immediate ceasefire wouldn't flip the switch on global oil flows.
This timeline presents an almost impossible equation for the Fed. The Dallas Fed's scenario analysis offers the clearest quantitative framework for what's at stake. Using a nonlinear Dynamic Stochastic General Equilibrium (DSGE) model of the global economy paired with a structural vector autoregression (SVAR), they model possible scenarios based on the potential duration of the Strait of Hormuz closure lasting one, two, or three quarters, against a baseline WTI price of roughly $60/barrel pre-war. The findings are striking: a one-quarter closure would lift Q3/Q4 headline PCE inflation by 0.35 percentage points, with WTI peaking around $110/barrel in Q1. Extend the closure to two quarters, and WTI peaks at $132/barrel in July, pushing headline PCE up 0.79 points. A three-quarter closure, increasingly plausible given the mine-clearing timeline, sends WTI to $167/barrel in October and headline PCE up 1.47 percentage points for the year. Core PCE, harder to dismiss as transitory, rises 0.49 points in the worst case. Critically, the Dallas Fed's more calibrated ‘current conditions’ estimate, accounting for a 15% supply shortfall rather than full closure, pegs the baseline hit to Q3/Q4 headline inflation at 0.6 percentage points and core at 0.2 points, with 1-year household expectations up 0.4 points at their Q2 peak. Long-run expectations remain largely anchored, which is the one concession to optimism here. Still, with Fed funds futures already pricing out near-term cuts, the FOMC is walking a razor's edge between a softening labour market that may need support and an energy-driven inflation pulse that makes loosening politically untenable. Rate cuts look like a 2027 story unless talks break positively in the coming days.
In credit markets, the canary is getting louder. Credit markets are quietly sending a warning signal that equity investors seem to be ignoring. Bloomberg news reported this week that junk bond investors are squeezing borrowers for stronger covenant protections, a notable reversal after years of issuer-friendly terms, with companies like Sealed Air, Golden Goose and TDC Brands all conceding to creditor demands. It's a small but telling data point: when sophisticated fixed income players start demanding better legal protections; it usually means they're less confident in the macro backdrop than headline spread levels suggest. US High Yield spreads have held up better than the macro noise might imply. The ICE BofA US High Yield Index Option Adjusted Spread (OAS) sat around 285 bps as of 21 April, but the underlying composition is increasingly bifurcated. The Financial Times noted investors pulled nearly $14 billion from US junk bond funds in a single month, while The Wall Street Journal flagged that loans to highly leveraged private equity-backed companies are bearing the brunt of the pressure. The covenant squeeze story, in that context, reflects investors quietly demanding more protection ahead of what could be a prolonged period of elevated rates and slowing growth.
Remarkably, the technology sector has defied macro headwinds’ gravity. Bloomberg news reported chipmakers are on track for a record 16th consecutive day of gains, with the Philadelphia Semiconductor Index rallying roughly 39% over the streak on the back of sustained AI capex optimism. European chip and electrical stocks followed suit, surging on the same AI earnings enthusiasm. The divergence, marked by credit tightening on one side and semiconductor euphoria on the other, underscores a market that has differentiated between rate-sensitive, macro-exposed sectors and AI-infrastructure plays, perceived as driven by long-term trends rather than cyclical forces. How long that distinct separation lasts is the defining question for H2 2026. If Hormuz flows don't recover on schedule and oil stays elevated through Q3, the inflation impulse feeding into rates will eventually find its way into equity risk premiums. The credit market is already starting to ask that question. Equities haven't answered it yet.
Corporate Earnings Calendar
Thursday: American Express, Blackstone, Keurig Dr Pepper, Intel, Newmont, Thermo Fisher Scientific
Friday: Procter & Gamble, SLB
Monday: Verizon
Tuesday: Booking Holdings, Coca-Cola, General Motors, Mondelez International, Robinhood Markets, Spotify, Starbucks, Visa
Wednesday: Abbvie, ADP, Alphabet, Amazon, Etsy, Fiverr, Ford Motor, Lemonade, Markel Group, Meta Platforms, Microsoft, Qualcomm
Global market indices
US Stock Indices Price Performance
Nasdaq 100 +13.47% MTD and +6.68% YTD
Dow Jones Industrial Average +6.06% MTD and +2.26% YTD
NYSE +4.13% MTD and +4.53% YTD
S&P 500 +9.33% MTD and +4.27% YTD
The S&P 500 is +1.67% over the past seven days, with 8 of the 11 sectors up MTD. The Equally Weighted version of the S&P 500 is +1.40% over this past week and +5.69% YTD.
The S&P 500 Information Technology is the leading sector so far this month, +17.84% MTD and +6.94% YTD, while Energy is the weakest sector at -8.24% MTD and +25.94% YTD.
Over the past seven days, Information Technology outperformed within the S&P 500 at +4.55%, followed by Consumer Staples and Energy at +1.52% and +1.40%, respectively. Conversely, Utilities underperformed at -2.57%, followed by Health Care and Communication Services at -0.98% and -0.50%, respectively.
The equal-weight version of the S&P 500 was 0.00% on Wednesday, underperforming its cap-weighted counterpart by 1.05 percentage points.
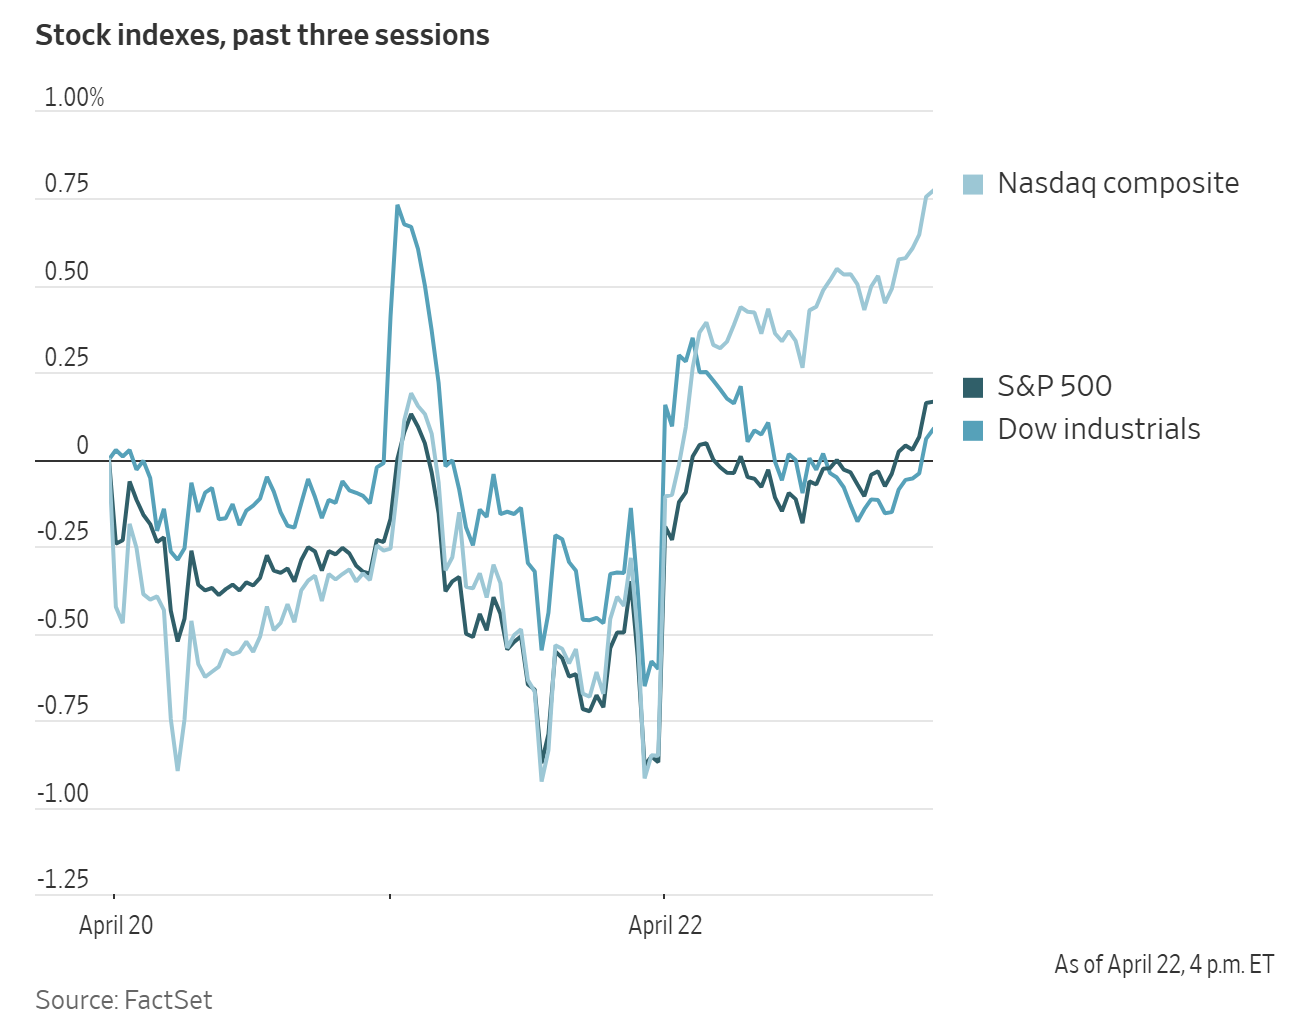
On Wednesday, the Dow Jones Industrial Average rose by +0.69%, or 340.65 points, to close at 49,490.03. The S&P 500 advanced +1.05% to 7,137.90, a new record. The Nasdaq Composite posted a gain of +1.64% to 24,657.57. Over the past seven days, the S&P 500 is up by +1.64%, the Dow Jones by +1.17% and the Nasdaq Composite +2.67%.
In corporate news, Lululemon Athletica named Heidi O’Neill its new chief executive officer as the athletic retailer.
According to Bloomberg news, in a potential blow to ASML Holding, Taiwan Semiconductor Manufacturing will delay deploying ASML Holding’s most cutting-edge lithography machines for chip production through 2029 to save money.
Mega caps: The Magnificent Seven had a mostly positive performance over the past week. Over the last seven days, Microsoft +5.28%, Apple +3.71%, Amazon +2.27%, Nvidia +1.83% and Alphabet +0.65%, while Meta Platforms -0.32% and Tesla -1.13%.
Tesla Q1 earnings. Tesla delivered a genuine earnings beat on Wednesday and a CapEx guidance that warrants caution. Q1 EPS came in at $0.41, surpassing both analysts’ consensus estimate of $0.35 and Tesla's own more conservative internal estimate of $0.33. Revenue for the period reached $22.387 billion, marking a 15.8% y/o/y increase from $19.335 billion and slightly ahead of the anticipated $22.100 billion.
While EPS exceeded expectations, Tesla’s gross margin performance was one of the Q1 highlights. Gross margin rose to 19.4%, an improvement of 310 basis points compared to the 16.3% recorded a year earlier. This outperformance, relative to Wall Street’s modelled margin closer to 18.5%, signals a potential shift in the company’s profitability narrative should the trend persist.
The main story, however, centred around FCF. Analysts had forecasted negative FCF of $1.539 billion for Q1; instead, Tesla reported positive FCF of $1.422 billion. Operating Cash Flow registered $3.937 billion, a 54.7% y/o/y increase and above the consensus estimate of $2.687 billion. This strong cash flow provides Elon Musk with more firepower and, crucially, additional time to pursue innovation in the evolving AI economy.
The narrative, however, quickly pivoted to spending. CFO Vaibhav Taneja revised FY CapEx guidance to exceed $25 billion, more than doubling the 2025 base of $9 billion and surpassing the previously announced $20 billion guidance. Elon described 2026 as ‘an exhilarating year’ and highlighted upcoming milestones in Cybercab, Optimus, FSD expansion and the Terafab chip manufacturing facility. However, the market hedged, with the initial enthusiasm moderating as investors assessed the implications of $25 billion in CapEx for near-term profitability, particularly in light of the CFO’s confirmation that negative FCF is anticipated in 2026 due to substantial investments in factories and AI infrastructure.
The autonomy segment provided further insight. Active Full Self-Driving (FSD) subscriptions reached 1.28 million, representing a 51% y/o/y increase. The unsupervised Robotaxi service expanded to Dallas and Houston in April, complementing existing operations in Austin. Paid Robotaxi mileage nearly doubled on a sequential basis. FSD regulatory approval was granted in the Netherlands in April, with an EU Commission review expected in May and a target for China approval in the third quarter of 2026.
Demand signals added complexity to Tesla’s outlook. The company reported sustained growth in demand for its vehicles in the Asia-Pacific (APAC) and South American markets, as well as a rebound in EMEA and North America. A statement that can be considered unexpected, given that the automaker had just reported one of its worst quarters of auto sales a few weeks earlier. Deliveries totalled 358,023 units, reflecting a modest 6.3% y/o/y growth. Furthermore, a gap of 50,363 units between production (408,386 vehicles) and deliveries led to global inventory increasing to 27 days of supply, up from 15 days at the close of Q4, a structural tension that weakens the bullish case.
Energy stocks had a mostly positive performance this week. The Energy sector itself was +1.20%. WTI and Brent prices are +1.62% and +7.25%, respectively, over the past week. Over the last seven days, Energy Fuels +7.44%, Baker Hughes +4.11%, ConocoPhillips +3.09%, Halliburton +4.18%, BP +1.83%, Chevron +0.76%, APA +0.42%, ExxonMobil +0.33% and Occidental Petroleum +0.32%, while Marathon Petroleum -0.43%, Phillips 66 -0.49% and Shell -1.39%.
Materials and Mining stocks had a largely positive performance this week, with the Materials sector itself +0.68%. Over the past seven days, Freeport-McMoRan +2.42%, Albemarle +4.77%, Nucor +13.01%, Celanese Corporation +1.16%, CF Industries +1.37% and Mosaic +3.33%, while Yara International -2.29%, Sibanye Stillwater -1.79% and Newmont Corporation -1.05%.
European Stock Indices Price Performance
Stoxx 600 +5.27% MTD and +3.66% YTD
DAX +6.68% MTD and -1.21% YTD
CAC 40 +4.34% MTD and +0.09% YTD
IBEX 35 +5.61% MTD and +4.04% YTD
FTSE MIB +7.84% MTD and +6.32% YTD
FTSE 100 +2.95% MTD and +5.49% YTD
This week, the pan-European Stoxx Europe 600 index is down -0.55%. It declined -0.35% on Wednesday, closing at 613.88.
So far this month in the STOXX Europe 600, Technology is the leading sector +13.40% MTD and +7.01% YTD, while Oil & Gas is the weakest at -1.97% MTD and +33.23% YTD.
Over the past seven days, Technology outperformed within the STOXX Europe 600, at +3.85%, followed by Basic Resources and Financials at +1.44% and +1.37%, respectively. Conversely, Travel & Leisure underperformed at -3.14%, followed by Health Care and Banks at -1.96% and -1.95%, respectively.
Germany's DAX index was -0.31% on Wednesday, closing at 24,194.90. It is up +0.53% over the past seven days. France's CAC 40 index was -0.96% Wednesday, closing at 8,156.43. It declined -1.43% over the past week.
The UK's FTSE 100 index was down -0.79% over the past seven days to 10,476.46. It was -0.21% on Wednesday.
Oil & Gas was the outperformer Wednesday as crude prices climbed amid ongoing regional supply concerns and developments related to Iran. Basic resources also advanced as commodity prices increased, supported by positive production and earnings updates, including BHP Group, which provided a solid update with copper guidance upgraded to the top of prior range and the CMRG dispute resolved.
Utilities and Real Estate benefitted from classic defensive rotation, as investors looked for yield and stability amid geopolitical uncertainty and rising energy costs, which are weighing on growth-sensitive market segments. Chemicals was bolstered by strong earnings; Akzo Nobel outperformed after exceeding Q1 EPS estimates and demonstrating that pricing discipline and cost control offset FX headwinds and weaker volumes. Croda International traded higher after reaffirming its FY guidance, despite a modest Q1 revenue miss.
Technology continued to re-rate, driven primarily by AI. ASM International reached all-time highs following an exceptional Q1, with orders, margins and revenue exceeding expectations, supported by robust AI logic and foundry demand as well as a rebound in the Chinese market. Temenos also beat Q1 expectations in revenue, margins and FCF, led by strong subscription and maintenance growth, particularly in the Middle East and Africa, though the company maintained its FY guidance.
Travel & Leisure was the underperformer, affected by high fuel costs and concerns over demand. Deutsche Lufthansa announced plans to cut 20,000 summer flights to counter rising energy prices, while TUI Group reduced its EBIT guidance for the year, citing weak summer bookings and continued fallout from the Middle East. Personal & Household Goods also declined as Reckitt Benckiser shares dropped sharply after missing Q1 net revenue estimates, impacted by a mild cold and flu season and subdued demand in Europe. Danone exceeded Q1 estimates despite slower growth and challenges in the nutrition segment, and Moncler was among the few luxury brands to defy the overall trend, benefitting from strong growth in Asia.
Telecommunications also traded lower, as increased M&A activity heightened volatility. Deutsche Telekom declined following reports of a potential full merger with T-Mobile US, which, while offering governance and discount reduction opportunities, introduces uncertainty in the near term. Health Care remained under pressure as Sonova Holding fell due to negative implications from Australian peer Cochlear lowering its full-year guidance, while Valneva was downgraded to ‘sell’ by Goldman Sachs. Restricted US reimbursement for obesity drugs, particularly via CVS Caremark, brought renewed attention to Novo Nordisk, along with news of Amazon entering the GLP1 market.
Other Global Stock Indices Price Performance
MSCI World Index +8.72% MTD and +4.50% YTD
Hang Seng +4.58% MTD and +1.14% YTD
Over the past seven days, the MSCI World Index and Hang Seng Index are +0.91% and -0.06%, respectively.
Currencies
EUR +1.32% MTD and -0.32% YTD to $1.1708
GBP +2.11% MTD and +0.20% YTD to $1.3500
The dollar advanced on Wednesday as the standoff between Iran and the US in the Middle East war and lack of progress in peace talks weighed on investor sentiment.
The dollar index advanced +0.20% on Wednesday to 98.61. Over the past week, the dollar index is up +0.54%.
The euro traded at $1.1708, having touched its lowest since 13 April earlier in the session. The single currency recorded a -0.76% decline over the past week, its first decline in four weeks.
Sterling was relatively unchanged, up +0.01% to $1.3500. The BoE is widely expected to leave rates unchanged when it meets later this month, with markets assigning approximately a 10% probability of a hike. Over the past week, the pound has declined -0.38% against the US dollar.
Against the yen, the US dollar edged +0.02% higher to ¥159.41. Over the past week, the yen has declined -0.30%. The yen is -0.46% MTD and -1.76% YTD.
Note: As of 5:00 pm EDT 22 April 2026
Cryptocurrencies
Bitcoin +15.49% MTD and -10.15% YTD to $78,788.01
Ethereum +14.40% MTD and -19.31% YTD to $2,403.32
Bitcoin was +5.52% over the last seven days and Ethereum was +2.10%. On Wednesday, Bitcoin was +4.27% and Ethereum +3.90%. Cryptocurrencies have been riding a bullish trend this week with total market capitalisation growing by roughly 3.78% to over $2.58 trillion this week, according to Coinbase data. Bitcoin has sustained an upward trajectory to reach 11-week highs. It rose to as much as $79,486, its highest price since 31 January on Wednesday. The rise has been driven by corporate buying, led by Strategy’s purchase of $2.5 bn of Bitcoin, institutional demand for crypto ETFs, easing of geopolitical tensions in the war with Iran following the cease-fire extension, increasing overall risk appetite and short liquidations. Since the outbreak of the war at the end of February, Bitcoin has been largely range-bound, trading between $65,000 and $75,000. As noted by Bloomberg news, that holding pattern has been a reprieve from months of declines that has seen the token shed roughly 40% of its value from its $126,000 high in October 2025.
Note: As of 5:00 pm EDT 22 April 2026
Fixed Income
US 10-year yield -1.1 bps MTD and +6.9 bps YTD to 4.307%
German 10-year yield +0.8 bps MTD and +16.7 bps YTD to 3.014%
UK 10-year yield +29.9 bps MTD and +62.5 bps YTD to 5.155%
US Treasuries remained steady to slightly firmer on Wednesday.
In afternoon trading, the yield on the 10-year Treasury note edged up +0.8 bps to 4.307%, while the 30-year yield inched +0.1 bps higher to 4.904%. At the shorter end of the curve, yields on the two-year Treasury, sensitive to Fed fund rate expectations, increased +2.7 bps to 3.806%.
The Treasury’s $13 billion auction of 20-year bonds held on Wednesday was well-received and aligned with market expectations, pricing at 4.883%. This yield was slightly below the level anticipated at the bidding deadline, indicating that investors did not require a premium. The bid-to-cover ratio stood at 2.68 times, which was lower than that of the previous two auctions but modestly above the average of the past six sales.
Market participants were also considering remarks made by Fed Chair nominee Kevin Warsh during his confirmation hearing before the Senate Banking Committee on Tuesday.
In what proved to be a contentious session, Warsh assured lawmakers that monetary policy would remain insulated from political pressures, even as an ongoing Justice Department investigation involving current Fed Chair Jerome Powell threatens to delay Warsh’s confirmation process.
Over the past seven days, the US yield curve exhibited a modest flattening, with the spread between two-year and 10-year yields narrowing to 50.1 bps from 51.8 bps in the previous week.
At the front-end, the 2-year yield +3.6 bps over the past week, the 10-year yield ended the week +1.9 bps higher, and at the longer end, the 30-year yield advanced +0.4 bps.
According to CME Group's FedWatch Tool, Fed funds futures traders are now pricing in a 0.0% probability of a 25 bps rate hike at April’s FOMC meeting, from 1.0% last week. Fed funds futures traders are pricing in 7.1 bps of rate cuts in 2026, lower than the 9.0 bps of rate cuts priced in a week ago.
Across the Atlantic, in the UK, on Wednesday the 10-year gilt advanced +1.5 bps to 5.155%. Over the past seven days, it has risen by +39.7 bps.
Short-term eurozone government bond yields advanced on Wednesday, as investors appeared largely unfazed by the US President’s indefinite extension of the ceasefire with Iran.
German government bond yields reflected this movement, with the 10-year yield rising by +1.0 bps to 3.014%, and the two-year Schatz yield, known for its sensitivity to interest rate expectations, increasing by +6.6 bps to 2.587%. At the longer end of the curve, the 30-year German bond yield edged down by -0.7 bps to 3.539%.
According to the Financial Times, ECB policymaker Martins Kazaks remarked that the ECB enjoyed the ‘luxury’ of not having to rush into raising interest rates ahead of next week’s pivotal policy meeting.
During the past week, the German yield curve bear flattened as short-term rates rose and long-term rates declined. The yield on the 10-year German bond declined by -3.2 bps, while the two-year Schatz yield was +3.6 bps higher. At the longer end of the spectrum, the 30-year German yield traded -6.3 bps lower.
Money markets currently assign only a low probability to an ECB rate increase later this month, though two 25 bps hikes by year-end are almost fully priced in.
Italy’s 10-year BTP yield rose by +1.2 bps on Wednesday to 3.777%, with the spread over safe-haven Bunds rising slightly by 0.2 bps, to 76.3 bps from 76.1 bps the previous week. The Italian 10-year yield declined -3.0 bps throughout the week.
Italy recorded a budget deficit equal to 3.1% of gross domestic product last year, the national statistics bureau ISTAT confirmed on Wednesday. This result dashed hopes in Rome of exiting the European Union’s disciplinary process for excessive deficits.
The yield spread between German Bunds and 10-year UK gilts reached 214.1 bps on Wednesday, an increase of 42.9 bps over the past seven days.
The spread between US 10-year Treasuries and German Bunds is now 129.3 bps, an increase of 5.1 bps from last week’s 124.2 bps.
Over the course of the week, France’s 10-year OAT yield declined -3.3 bps. The spread between the French OAT 10-year yield and German Bund 10-year yield stood at 63.6 bps, 0.1 bps lower than last week’s 63.7 bps.
Commodities
Gold spot +0.81% MTD and +9.82% YTD to $4,737.78 per ounce
Silver spot +3.32% MTD and +8.89% YTD to $77.60 per ounce
West Texas Intermediate crude -8.56% MTD and +61.77% YTD to $92.87 a barrel
Brent crude -13.95% MTD and +67.13% YTD to $101.80 a barrel
Gold advanced on Wednesday, rebounding from a decline that had brought it to its lowest level in over a week during the previous trading session.
Spot gold advanced +0.55% to $4,737.78 per ounce, after approaching a one percent gain earlier in the day. On Tuesday, it had suffered its most significant daily loss since 26 March. Over the past week, gold prices declined -1.09%.
Spot silver increased by +1.17% to $77.60 per ounce. Over the past week, silver prices declined -1.84%.
Oil prices rose on Wednesday as peace negotiations between Washington and Tehran stalled, with both nations continuing to impose restrictions on trade through the Strait of Hormuz.
Brent crude futures increased by $2.55, or +2.57%, to $101.80 per barrel, closing above the $100 mark for the first time in over two weeks. WTI futures advanced $2.54, or +2.81%, to settle at $92.87 a barrel. Over the past week, WTI is up +1.62% and Brent is up +7.25%.
On Tuesday evening, the US President announced an extension of the ceasefire following a request from Pakistan's Prime Minister, who urged the administration to postpone any military action against Iran until Iranian leaders could present a unified peace proposal. Unconfirmed reports on Wednesday morning suggested President Trump wished to prolong the ceasefire for three to five days, with hopes of resuming face-to-face negotiations on Friday. Israeli sources indicated the US informed Israel that the ceasefire would last until Sunday. Multiple reports highlighted ongoing divisions among Iran's leadership and the Islamic Revolutionary Guard Corps regarding peace proposals, while Tehran reiterated that negotiations would not proceed unless the blockade was lifted. The Associated Press reported Iran had not yet decided whether to participate in new talks, while Tasnim stated Tehran had no plans to negotiate on Friday.
Further complicating peace efforts, Hezbollah announced it had attacked an Israeli military vehicle with a drone in response to truce violations, including an earlier incident in southern Lebanon that resulted in one fatality.
In addition, a suspected Iranian strike ignited a blaze at Iraq's Erbil refinery complex, while fires continued at Russia's Tuapse refinery. Since the beginning of April, approximately eighteen refineries have been affected by either war-related incidents or fires and explosions unrelated to the conflicts in Iran or Ukraine.
According to reports from The Washington Post, Iran may have deployed twenty or more mines in the Strait of Hormuz. The Pentagon has informed Congress that it could require up to six months to fully clear the mines from the waterway.
Goldman Sachs estimates that global visible oil inventories have declined by 255 million barrels since the onset of the conflict and are expected to reach record lows, even if the Strait is reopened by the end of this month.
EIA report. The latest US Energy Information Agency (EIA) report, released on Wednesday, showed that US crude oil refinery inputs averaged 16.0 million barrels per day during the week ending 17 April. This was 55 thousand barrels per day less than the previous week’s average. Refineries operated at 89.1% of their operable capacity last week. Gasoline production increased last week, averaging 10.1 million barrels per day. Distillate fuel production increased, averaging 5.0 million barrels per day.
US crude oil imports averaged 6.1 million barrels per day last week and increased by 787 thousand barrels per day from the prior week. Over the past four weeks, crude oil imports averaged about 6.0 million barrels per day; this is 0.4% less than the same four-week period last year.
Total motor gasoline imports last week averaged 587 thousand barrels per day and distillate fuel imports averaged 190 thousand barrels per day. US commercial crude oil inventories increased by 1.9 million barrels from the previous week.
US crude oil inventories, at 465.7 million barrels, are about 3% above the five-year average for this time of year. However, total motor gasoline inventories decreased by 4.6 million barrels from last week and are 0.5% below the five year average for this time of year. Finished gasoline inventories increased, while blending component inventories decreased last week. Distillate fuel inventories also fell last week, decreasing by 3.4 million barrels last week. They are about 8% below the five-year average for this time of year.
Total commercial petroleum inventories decreased by 1.8 million barrels last week. Total products supplied over the last four-week period averaged 20.5 million barrels per day, up by 3.0% from the same period last year. Over the past four weeks, motor gasoline product supplied averaged 8.8 million barrels per day, up by 1.7% from the same period last year. Distillate fuel product supplied averaged 4.0 million barrels per day over the past four weeks, up by 3.4% from the same period last year. However, jet fuel product supplied was down 6.5% compared with the same four-week period last year.
Note: As of 5:00 pm EDT 22 April 2026
Key data to move markets
EUROPE
Thursday: Speeches by German Bundesbank President Joachim Nagel, ECB President Christine Lagarde, ECB Non-Monetary policy meeting and French, German and Eurozone HCOB Composite, Manufacturing and Services PMIs
Friday: German IFO Business Climate, Current Assessment and Expectations Surveys
Tuesday: German GfK Consumer Confidence and ECB Bank Lending Survey
Wednesday: Spanish Harmonised Index of Consumer Prices, Eurozone Business Climate, Consumer Sentiment and Economic Sentiment Indicator, German CPI and German Harmonised Index of Consumer Prices
UK
Thursday: S&P Global Composite, Manufacturing and Services PMIs
Friday: GfK Consumer Confidence and Retail Sales
USA
Thursday: Initial and Continuing Jobless Claims and S&P Global Composite, Manufacturing and Services PMIs
Friday: Michigan Consumer Expectations Index, Michigan Consumer Sentiment Index and UoM 1 and 5-year Consumer Inflation Expectations
Tuesday: ADP Employment Change 4-week Average, Housing Price Index and Consumer Confidence
Wednesday: Building Permits, Durable Goods Orders, Durable Goods ex-Defence Orders, Housing Starts and Nondefence Capital Goods Orders
JAPAN
Friday: National CPI
Tuesday: BoJ Interest Rate Decision, Monetary Policy Statement and BoJ Outlook Report and Unemployment Rate
While every effort has been made to verify the accuracy of this information, EXT Ltd. (hereafter known as “EXANTE”) cannot accept any responsibility or liability for reliance by any person on this publication or any of the information, opinions, or conclusions contained in this publication. The findings and views expressed in this publication do not necessarily reflect the views of EXANTE. Any action taken upon the information contained in this publication is strictly at your own risk. EXANTE will not be liable for any loss or damage in connection with this publication.
Ten artykuł jest publikowany wyłącznie w celach informacyjnych i nie powinien być traktowany jako oferta lub zachęta do kupna lub sprzedaży jakichkolwiek inwestycji lub powiązanych usług, do których można się tu odwołać. Obrót instrumentami finansowymi wiąże się ze znacznym ryzykiem strat i może nie być odpowiedni dla wszystkich inwestorów. Wyniki osiągnięte w przeszłości nie są wiarygodnym wskaźnikiem wyników w przyszłości.


Zarejestruj się i otrzymuj informacje rynkowe
Zarejestruj się i otrzymuj
informacje
rynkowe
Subskrybuj teraz


Stworzone przez profesjonalistów. Dla profesjonalistów.
